ノーコードでエアコンの電力消費を可視化する手順(Telegraf + Promethes + Grafana Mimir + Grafana)ではRaspberry Pi環境内ですべて完結していましたが、Grafana Minirの代わりにAmazon Managed Service for Prometheus (AMP)を使うことも可能です。
「grafana」タグの記事が6件件あります
全てのタグを見るノーコードでエアコンの電力消費を可視化する手順(Telegraf + Promethes + Grafana Mimir + Grafana)
今年の夏も暑かったですね。エアコンがないとやってられませんでした。 ふと、エアコンの電力消費が気になりましたので可視化してみました。
Amazon Managed Service for PrometheusとAmazon Managed Grafana使ってみた
過去にQiitaに投稿した内容のアーカイブです。
Amazon Managed Service for PrometheusとAmazon Managed Grafanaを使ってRaspberry Piのメトリクスを可視化してみました。(名前が長い。。そして統一感がない。。)
Amazon Managed Service for Prometheusのセットアップ

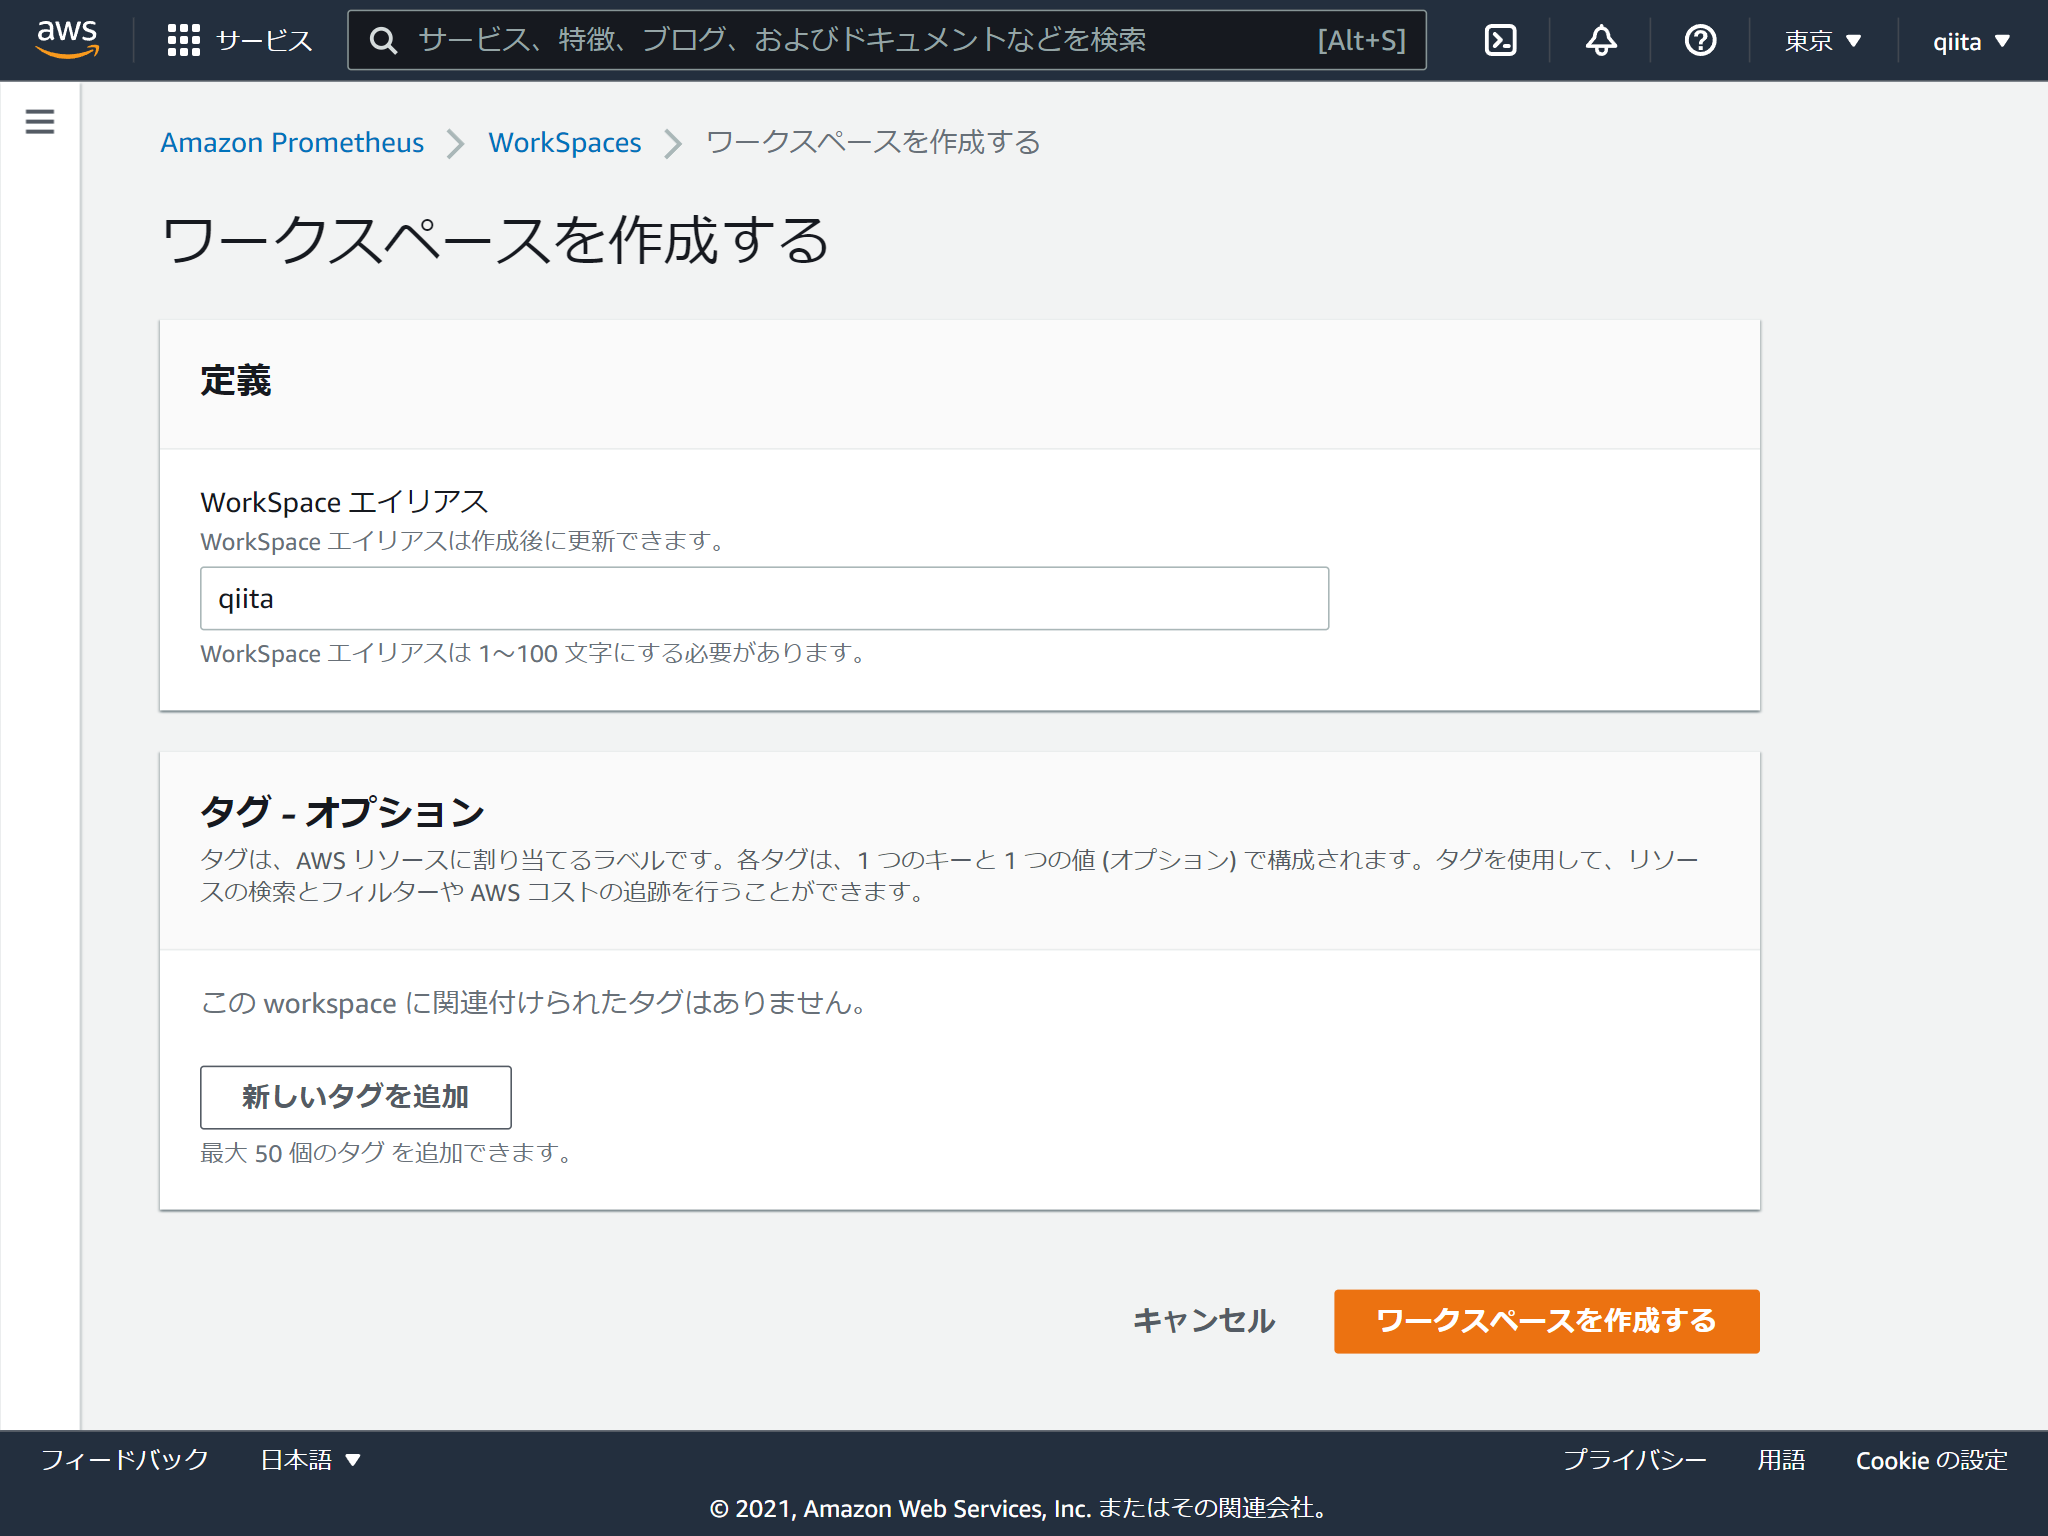
ワークスペースの名称を決めるだけです。
出来上がり。超簡単
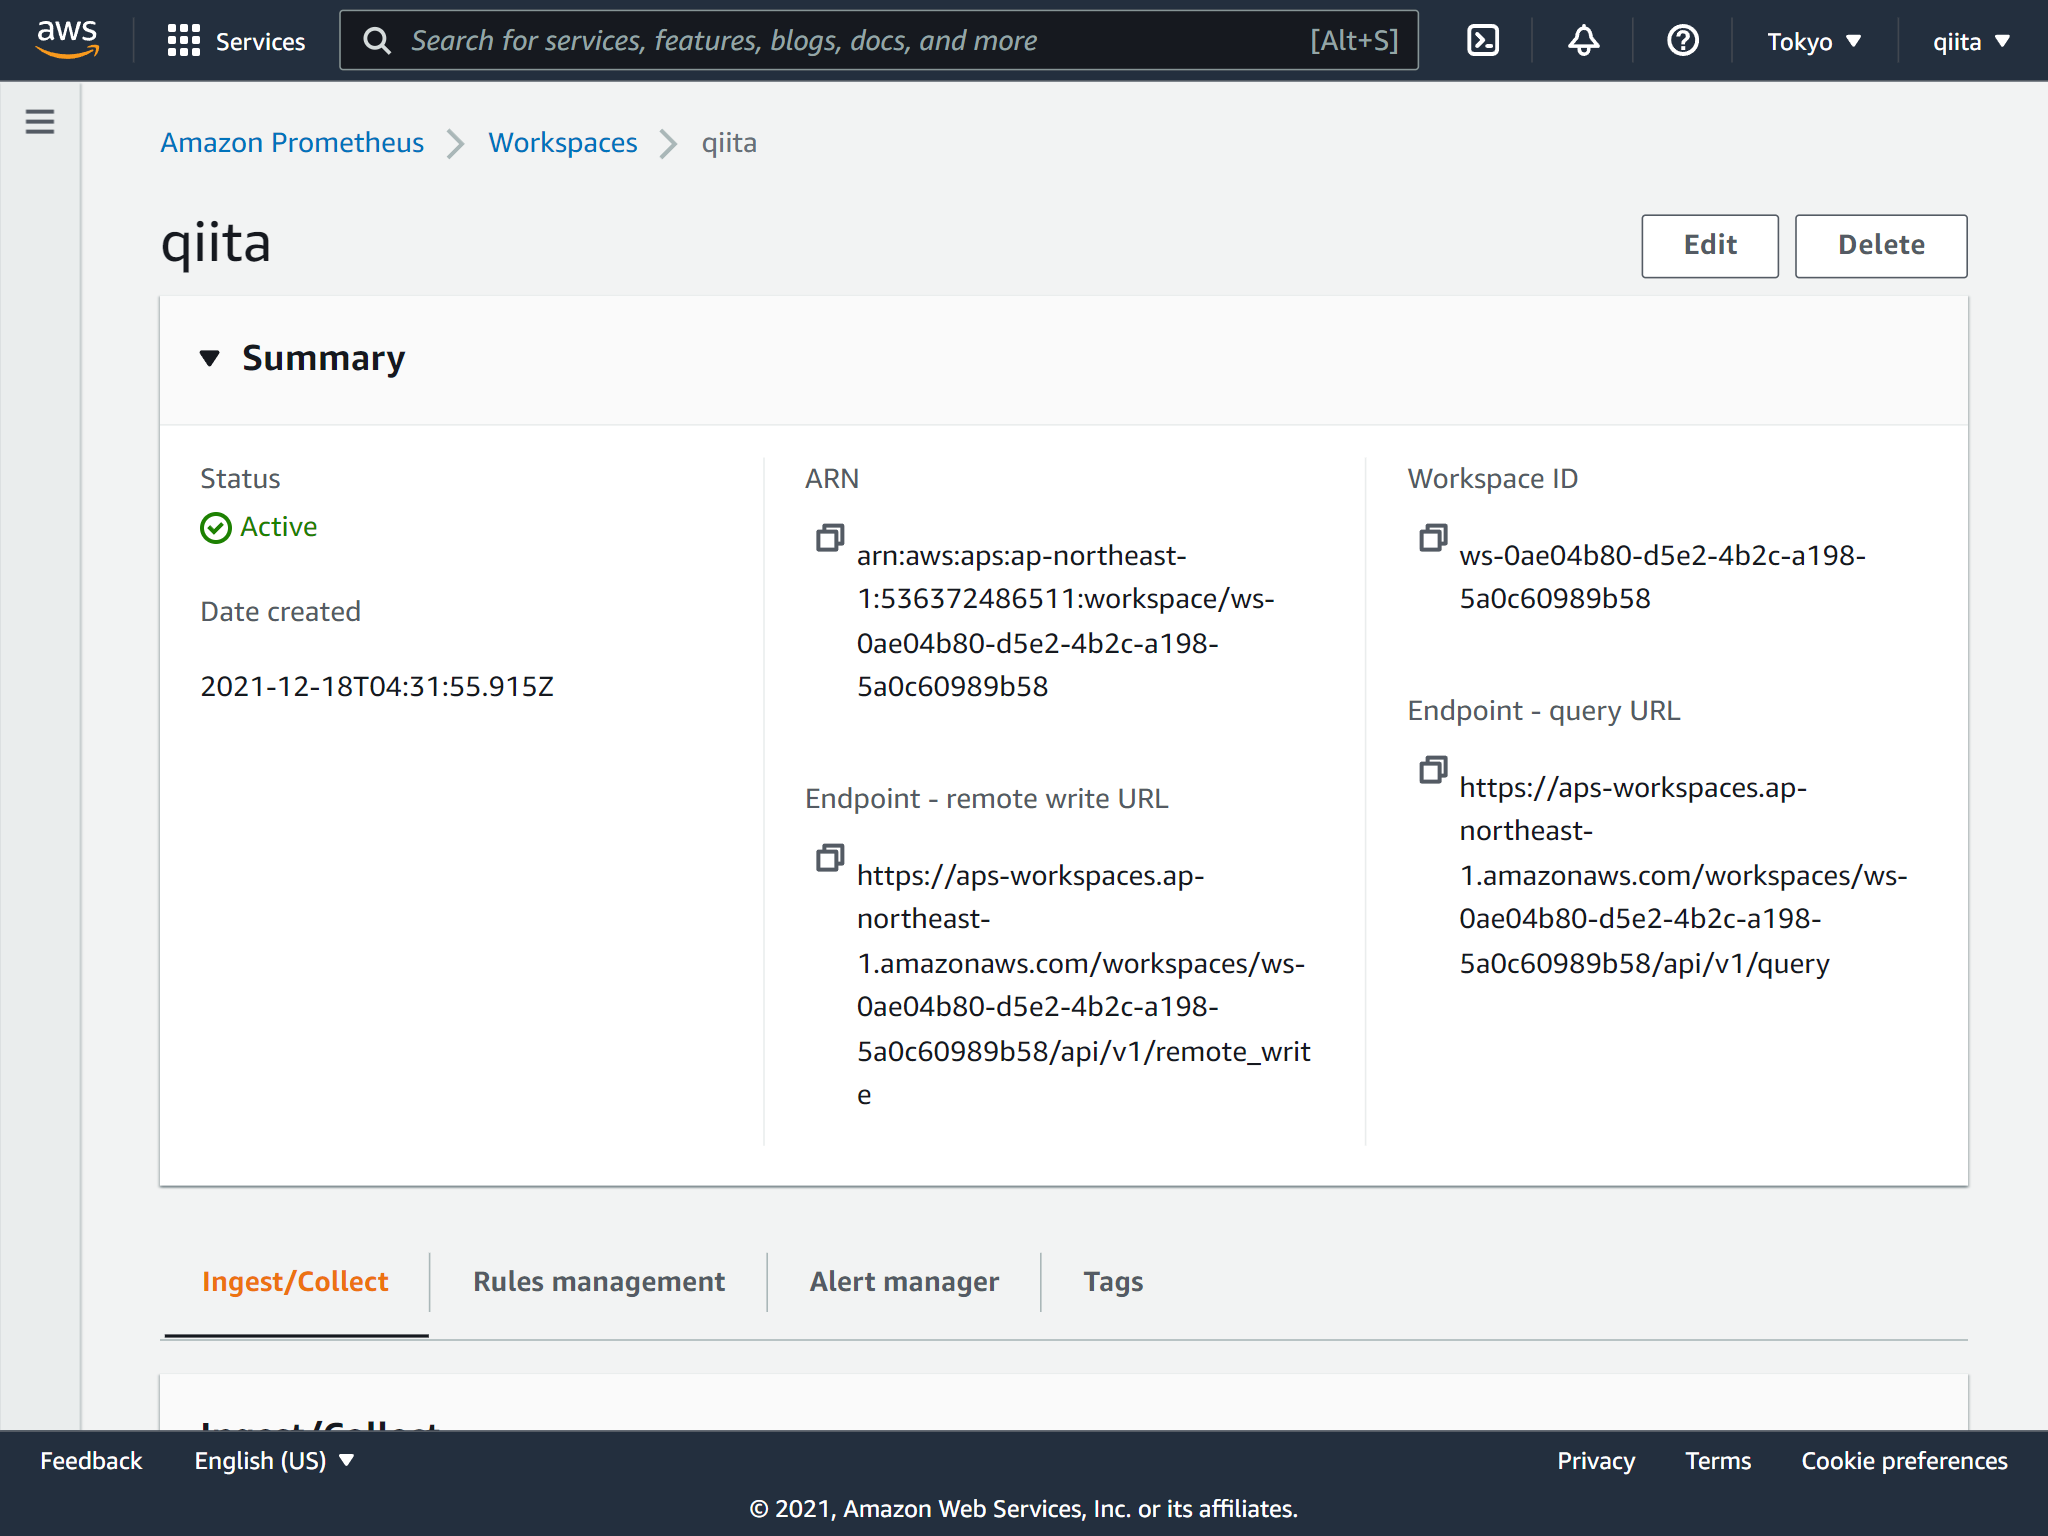
Raspberry Pi4からメトリクスを送信
IAMユーザーのアクセスキー情報が必要ですので、IAMユーザーを作成します。
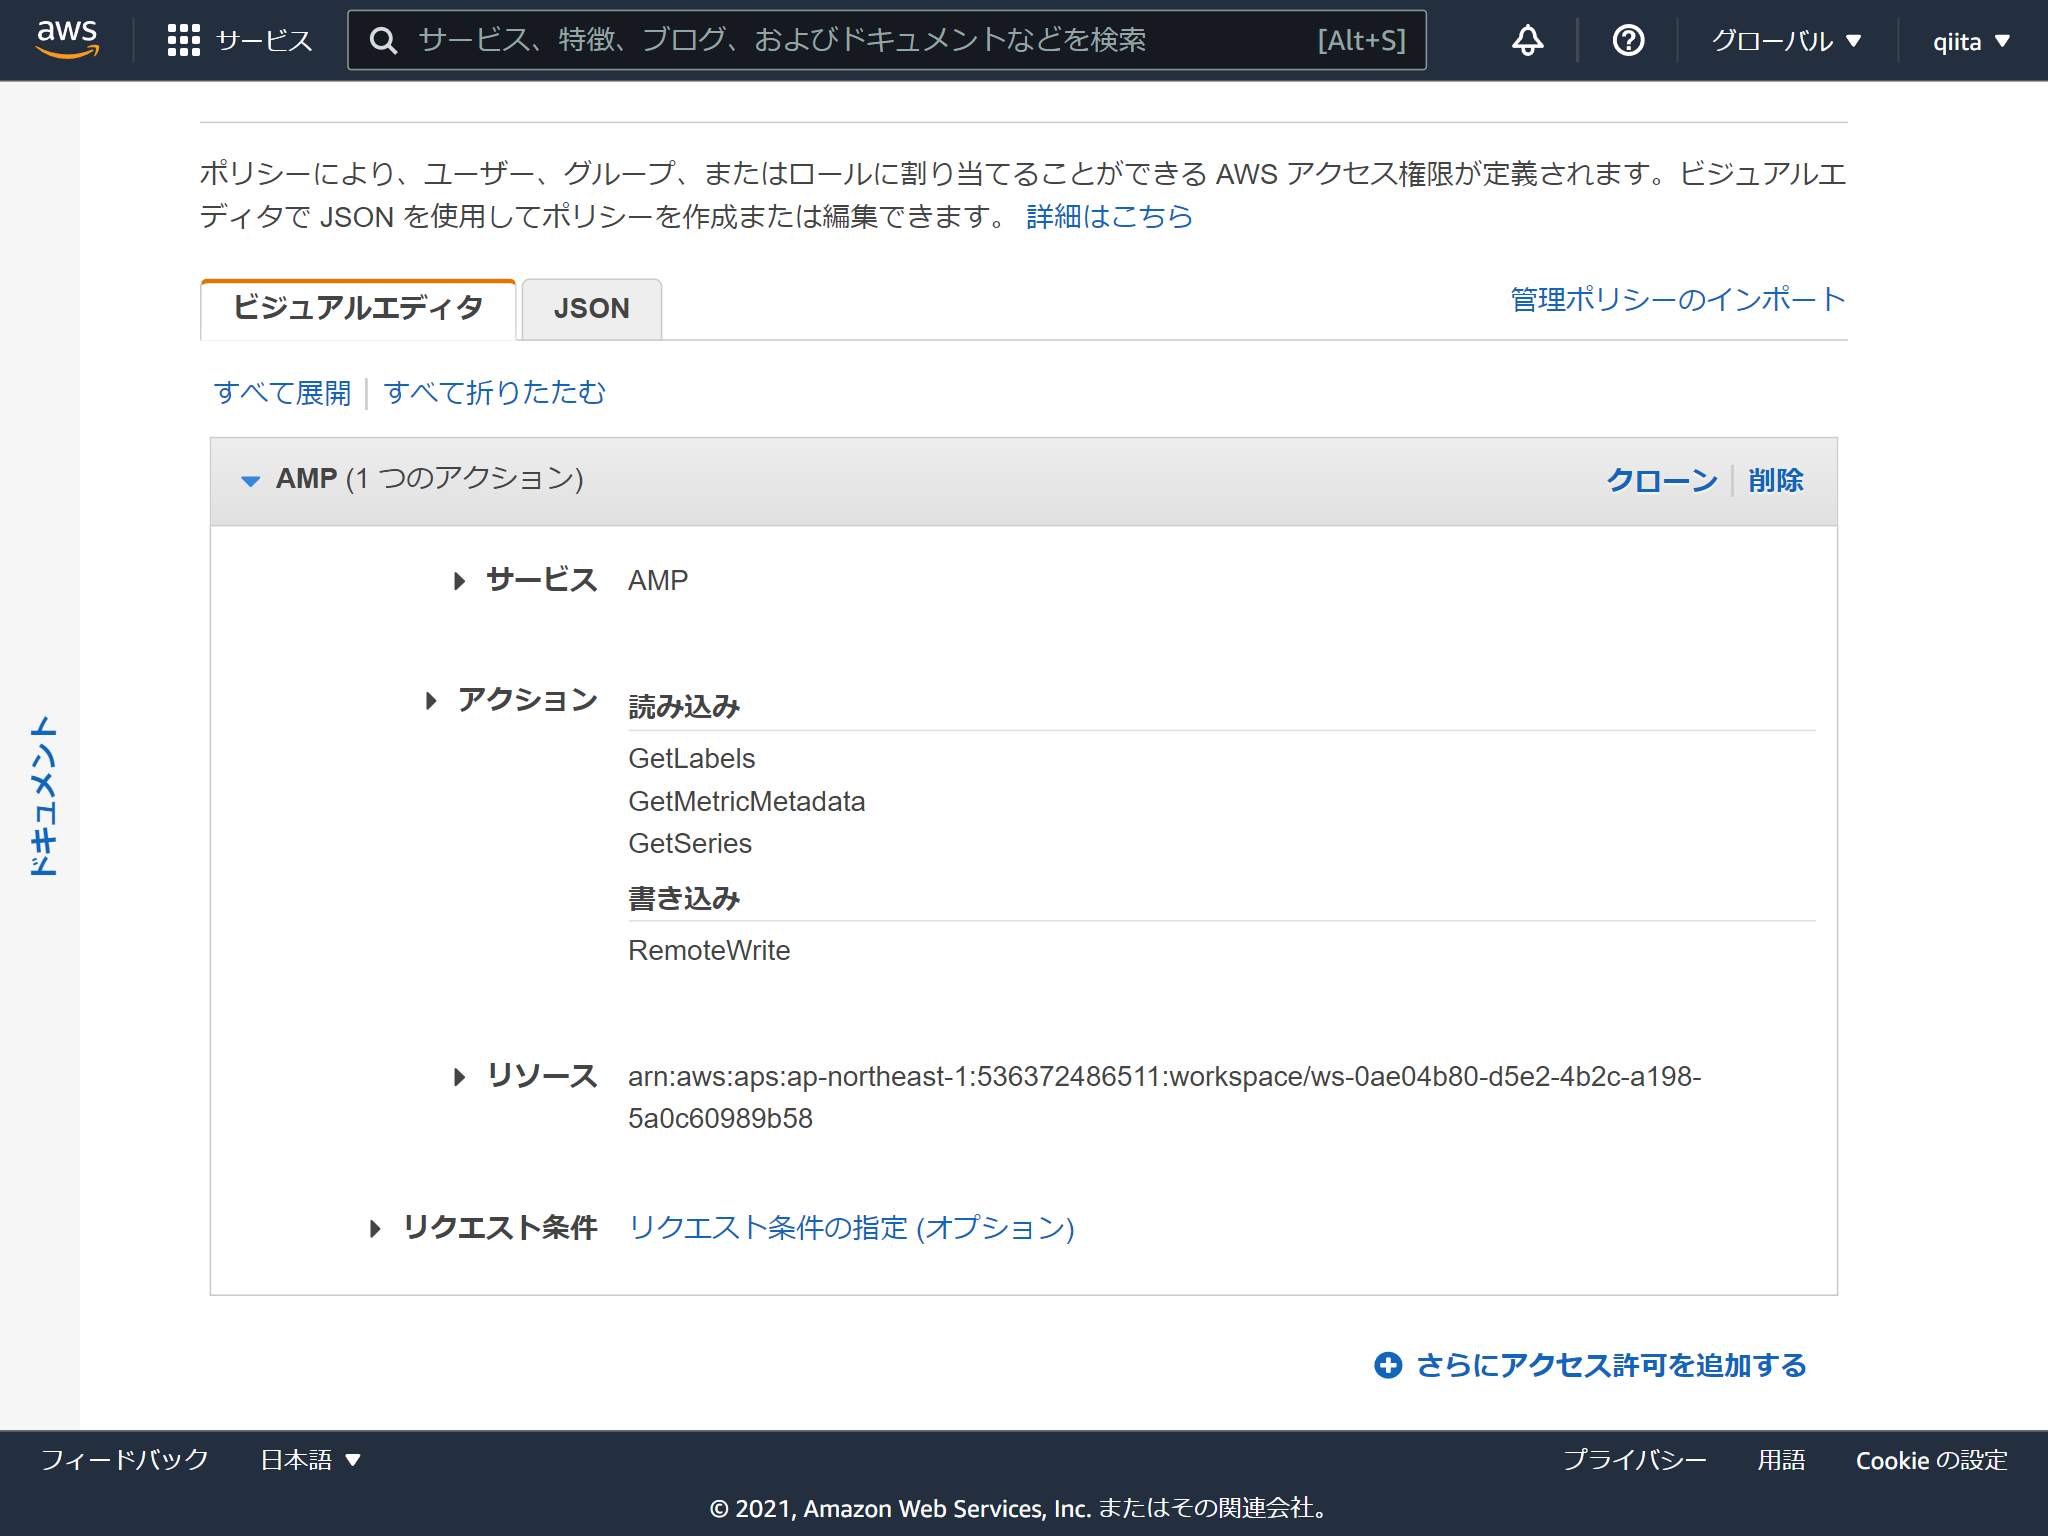
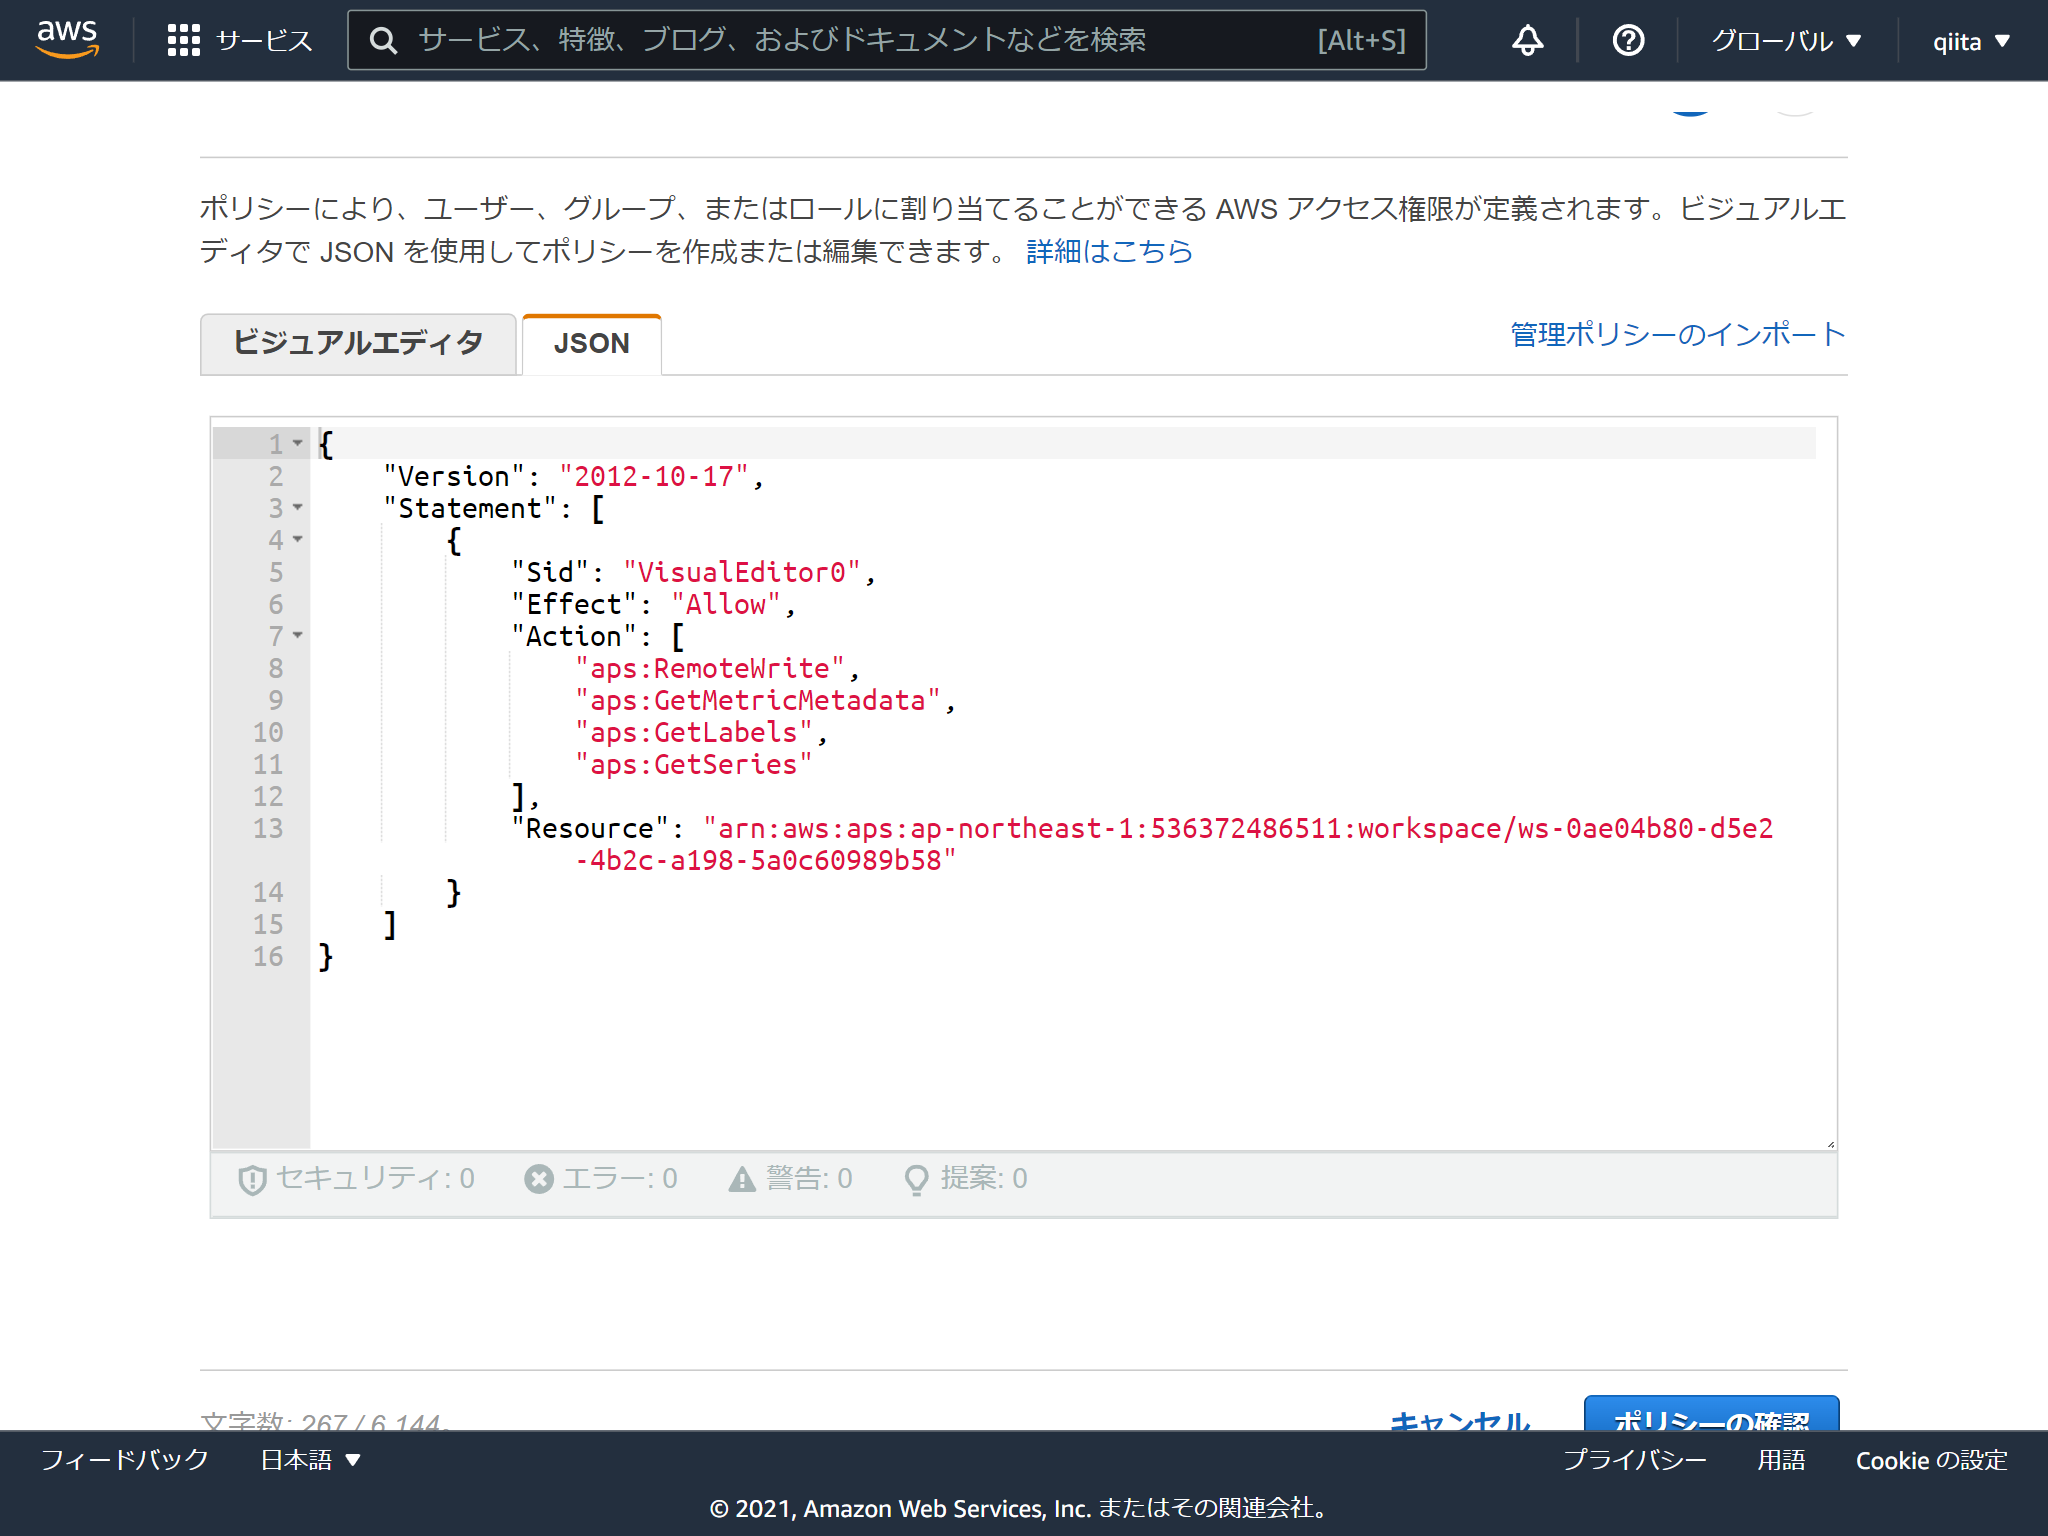
必要なポリシーはこんな感じです。aps:RemoteWriteだけでいいかもしれません。
注意点はなんといってもサービス名が AMP ってところです。さらにActionの接頭辞は aps (笑)
Docker ComposeでPrometheusとNode exporterを起動します。
version: '3.8'

services:
  prometheus:
    image: quay.io/prometheus/prometheus:latest
    network_mode: host
    volumes:
      - ./prometheus.yml:/etc/prometheus/prometheus.yml

  node-exporter:
    image: quay.io/prometheus/node-exporter:latest
    container_name: node_exporter
    command:
      - '--path.rootfs=/host'
    network_mode: host
    pid: host
    restart: unless-stopped
    volumes:
      - '/:/host:ro,rslave'
remote_writeのところに認証情報をセットします。
## my global config
global:
  scrape_interval:     15s # Set the scrape interval to every 15 seconds. Default is every 1 minute.
  evaluation_interval: 15s # Evaluate rules every 15 seconds. The default is every 1 minute.
  # scrape_timeout is set to the global default (10s).

## Alertmanager configuration
alerting:
  alertmanagers:
  - static_configs:
    - targets:
      # - alertmanager:9093

## Load rules once and periodically evaluate them according to the global 'evaluation_interval'.
rule_files:
  # - "first_rules.yml"
  # - "second_rules.yml"

## A scrape configuration containing exactly one endpoint to scrape:
## Here it's Prometheus itself.
scrape_configs:
  # The job name is added as a label `job=<job_name>` to any timeseries scraped from this config.
  - job_name: 'prometheus'

    # metrics_path defaults to '/metrics'
    # scheme defaults to 'http'.

    static_configs:
    - targets: ['localhost:9090']

  - job_name: 'node'

    static_configs:
    - targets: ['localhost:9100']

remote_write:
- url: https://aps-workspaces.ap-northeast-1.amazonaws.com/workspaces/ws-0ae04b80-d5e2-4b2c-a198-5a0c60989b58/api/v1/remote_write

  sigv4:
    # The AWS region. If blank, the region from the default credentials chain
    # is used.
    region: ap-northeast-1

    # The AWS API keys. If blank, the environment variables `AWS_ACCESS_KEY_ID`
    # and `AWS_SECRET_ACCESS_KEY` are used.
    access_key: XXXXXXXXXXXXXXXXXXXX
    secret_key: XXXXXXXXXXXXXXXXXXXX
起動します
## docker-compose up
Amazon Managed Grafanaのセットアップ

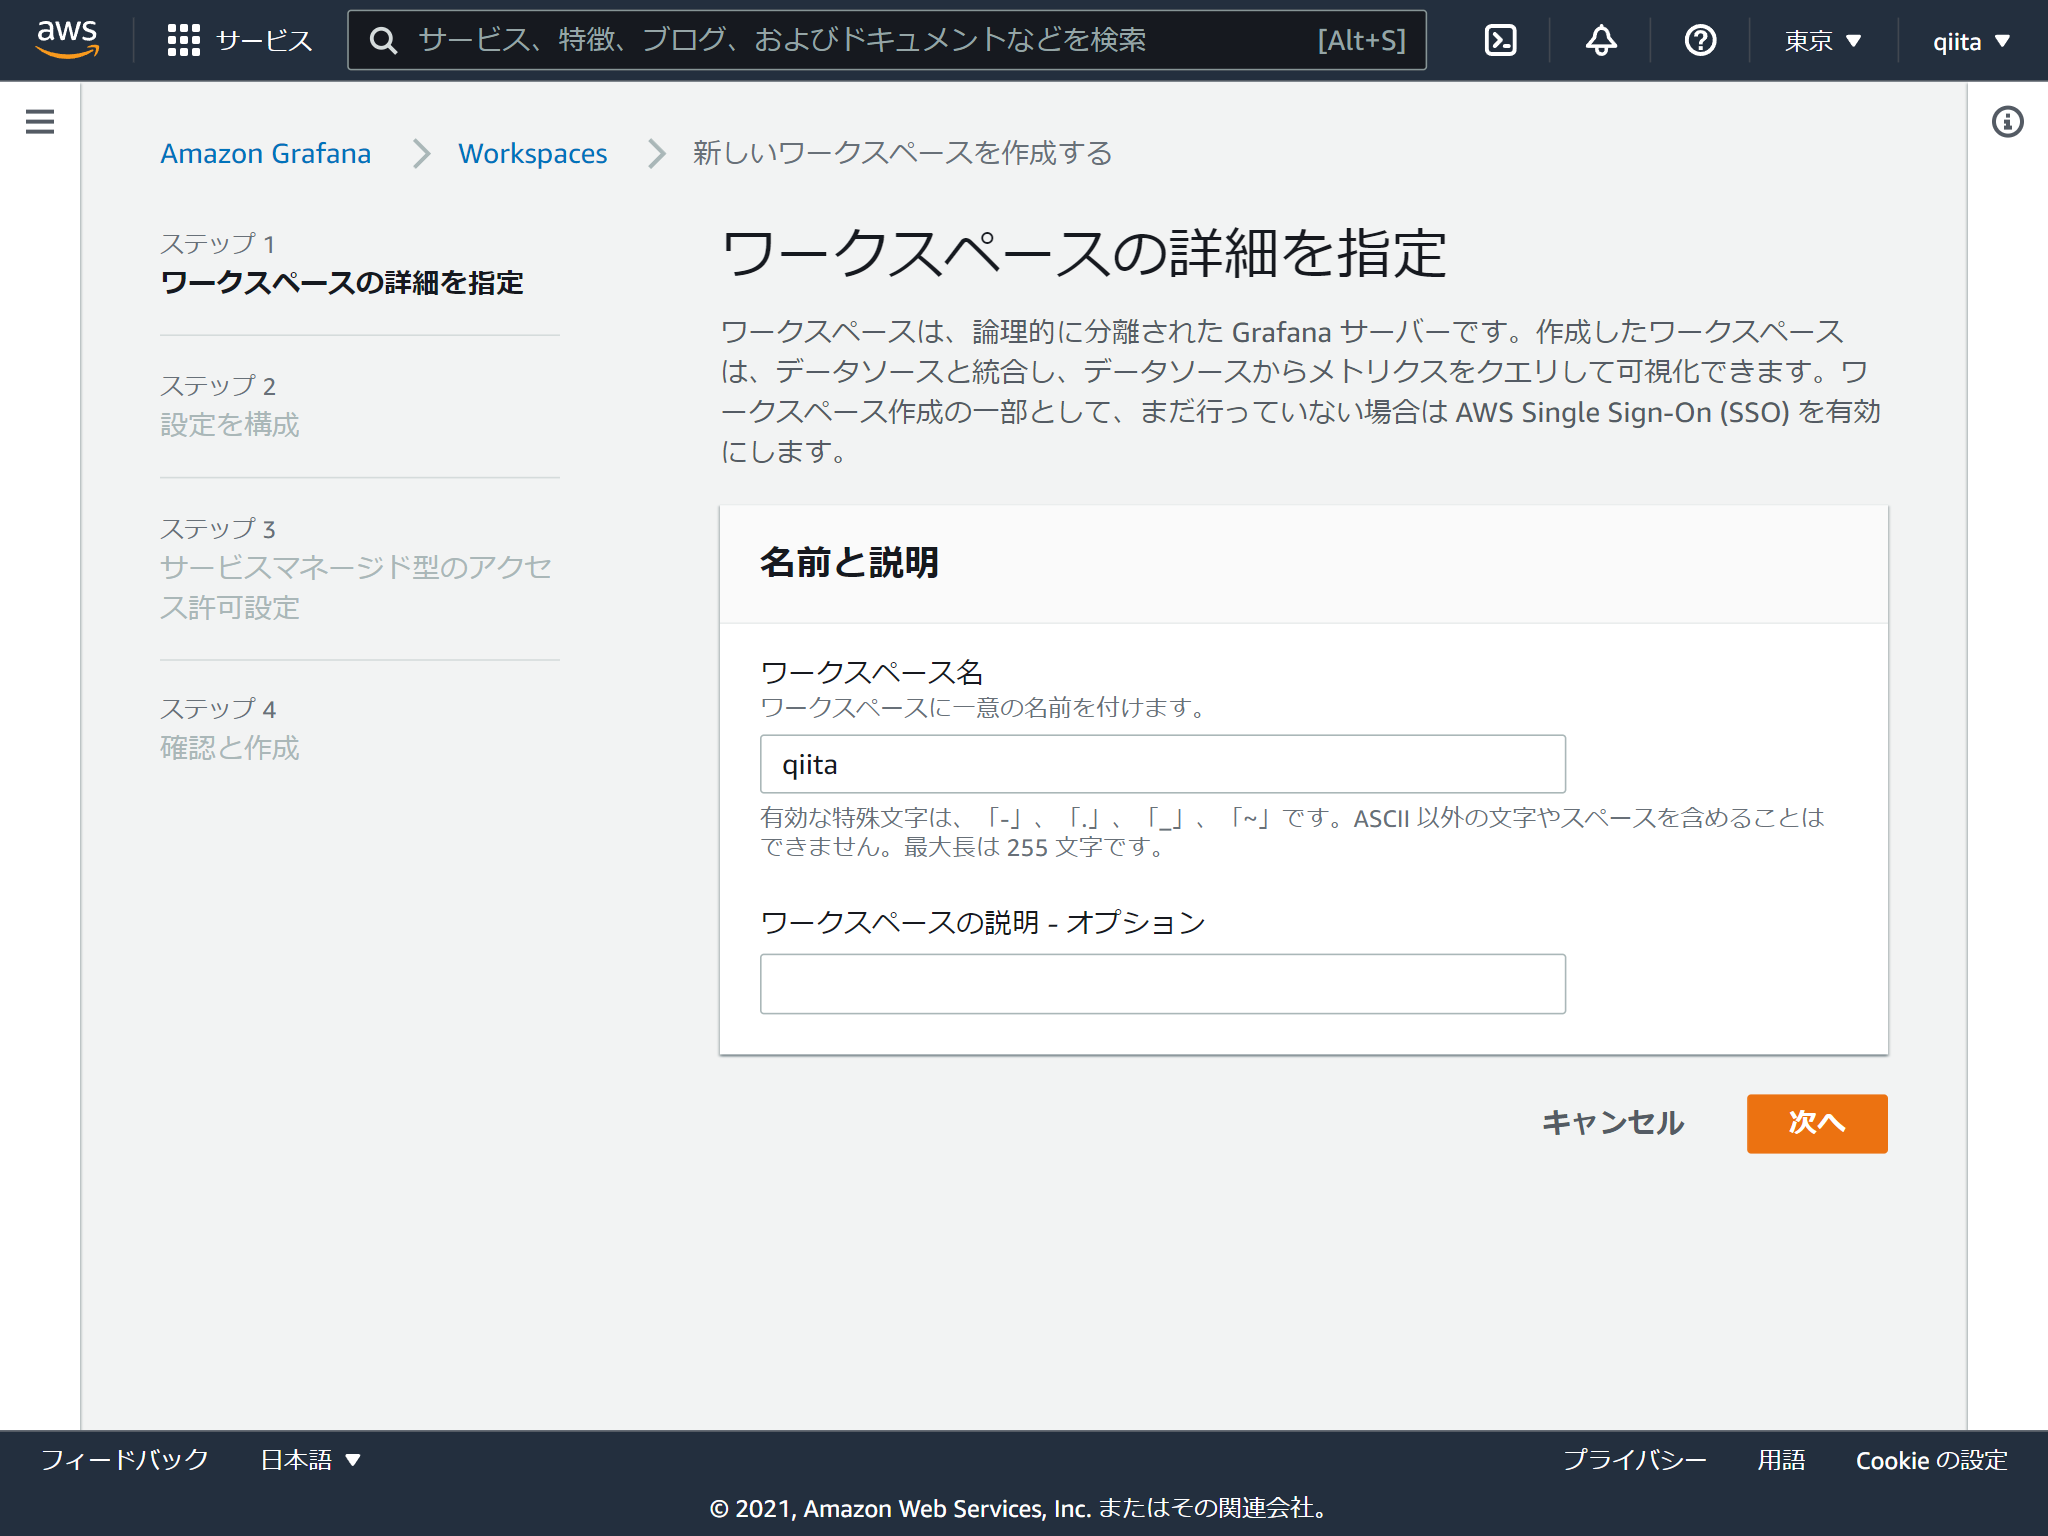
ワークスペース名をつけます
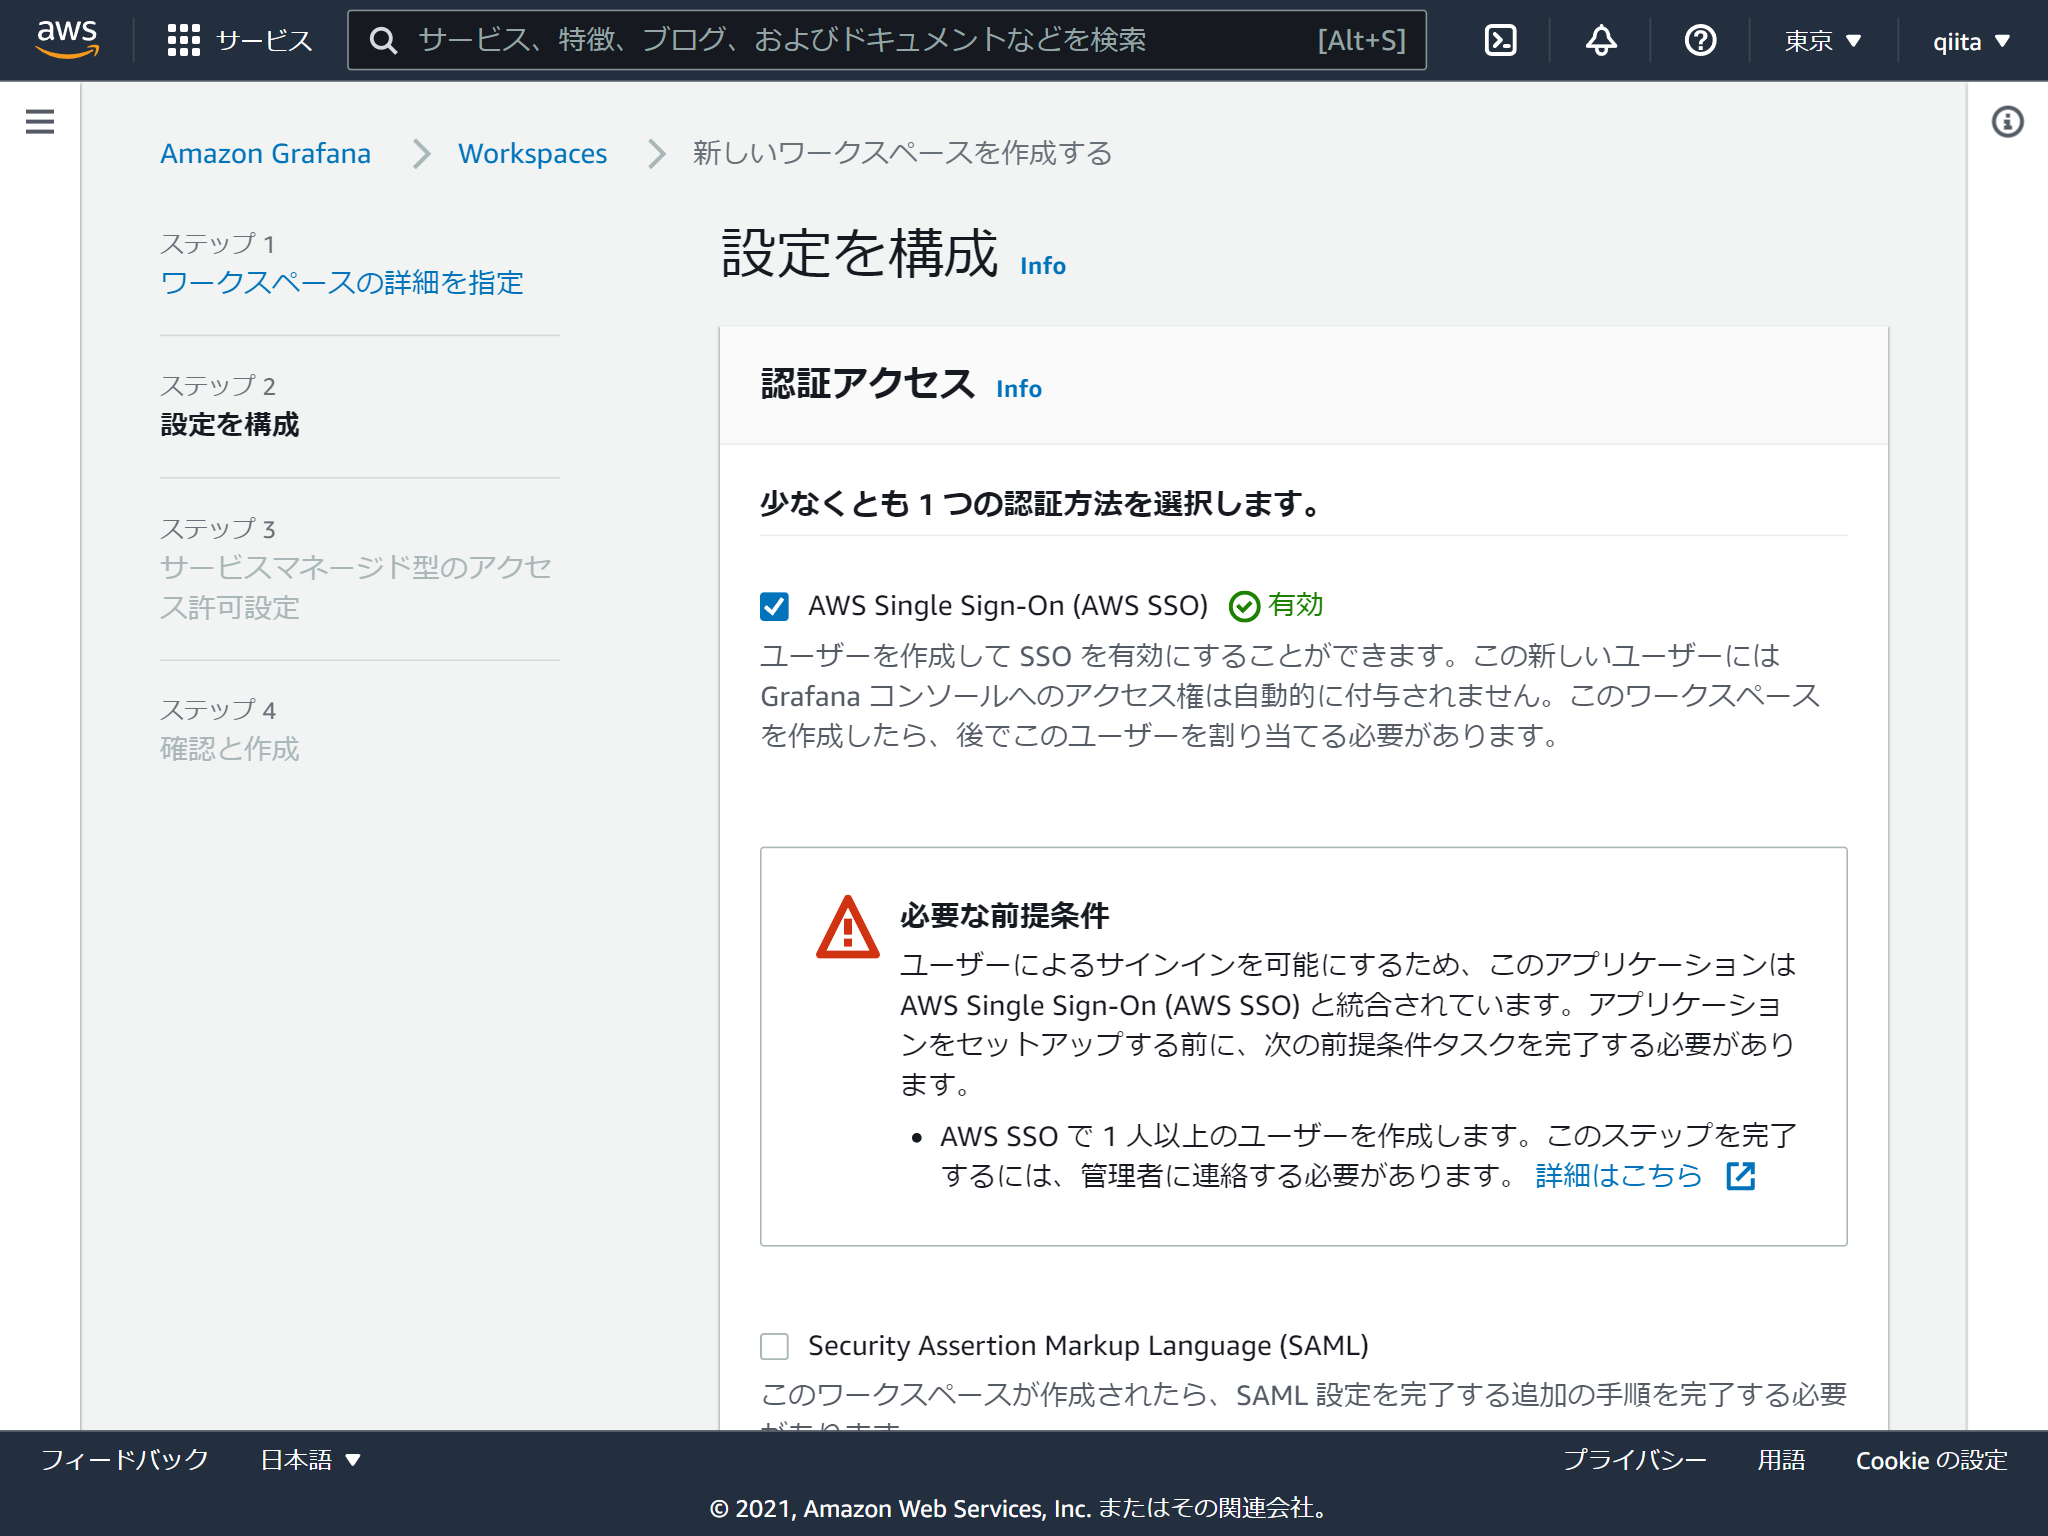
Grafanaの画面にログインする際に使う認証情報を選択します。AWS SSOにしてみました。
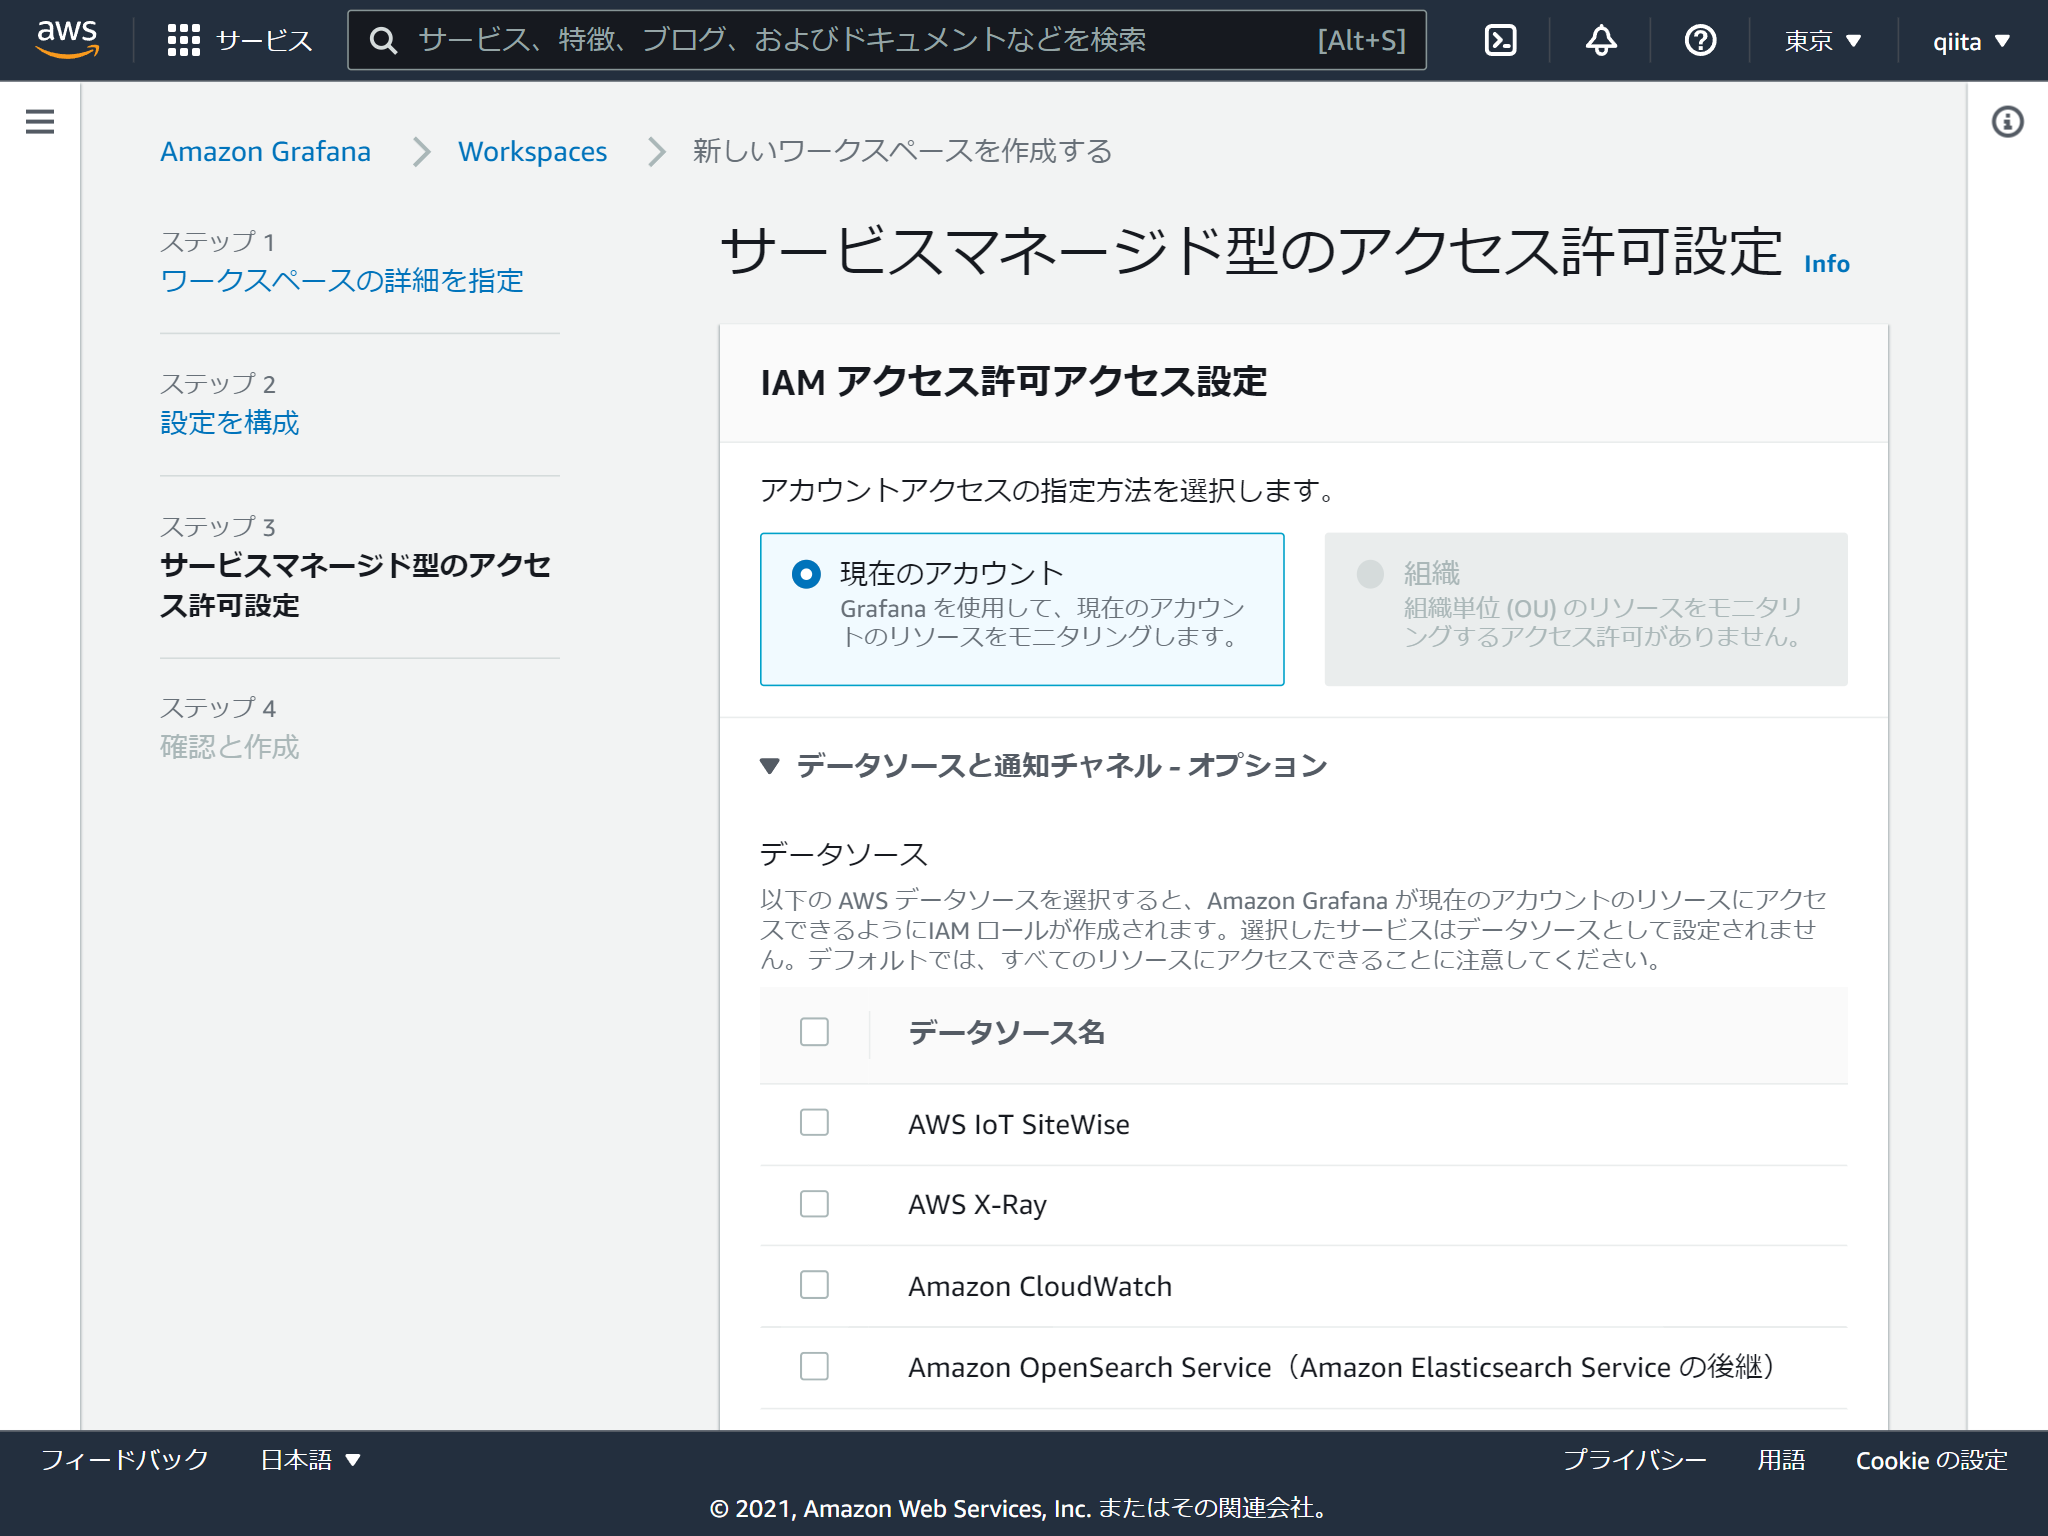
GrafanaがアクセスするAWSのリソースを選択します。 あとからも変更できます。
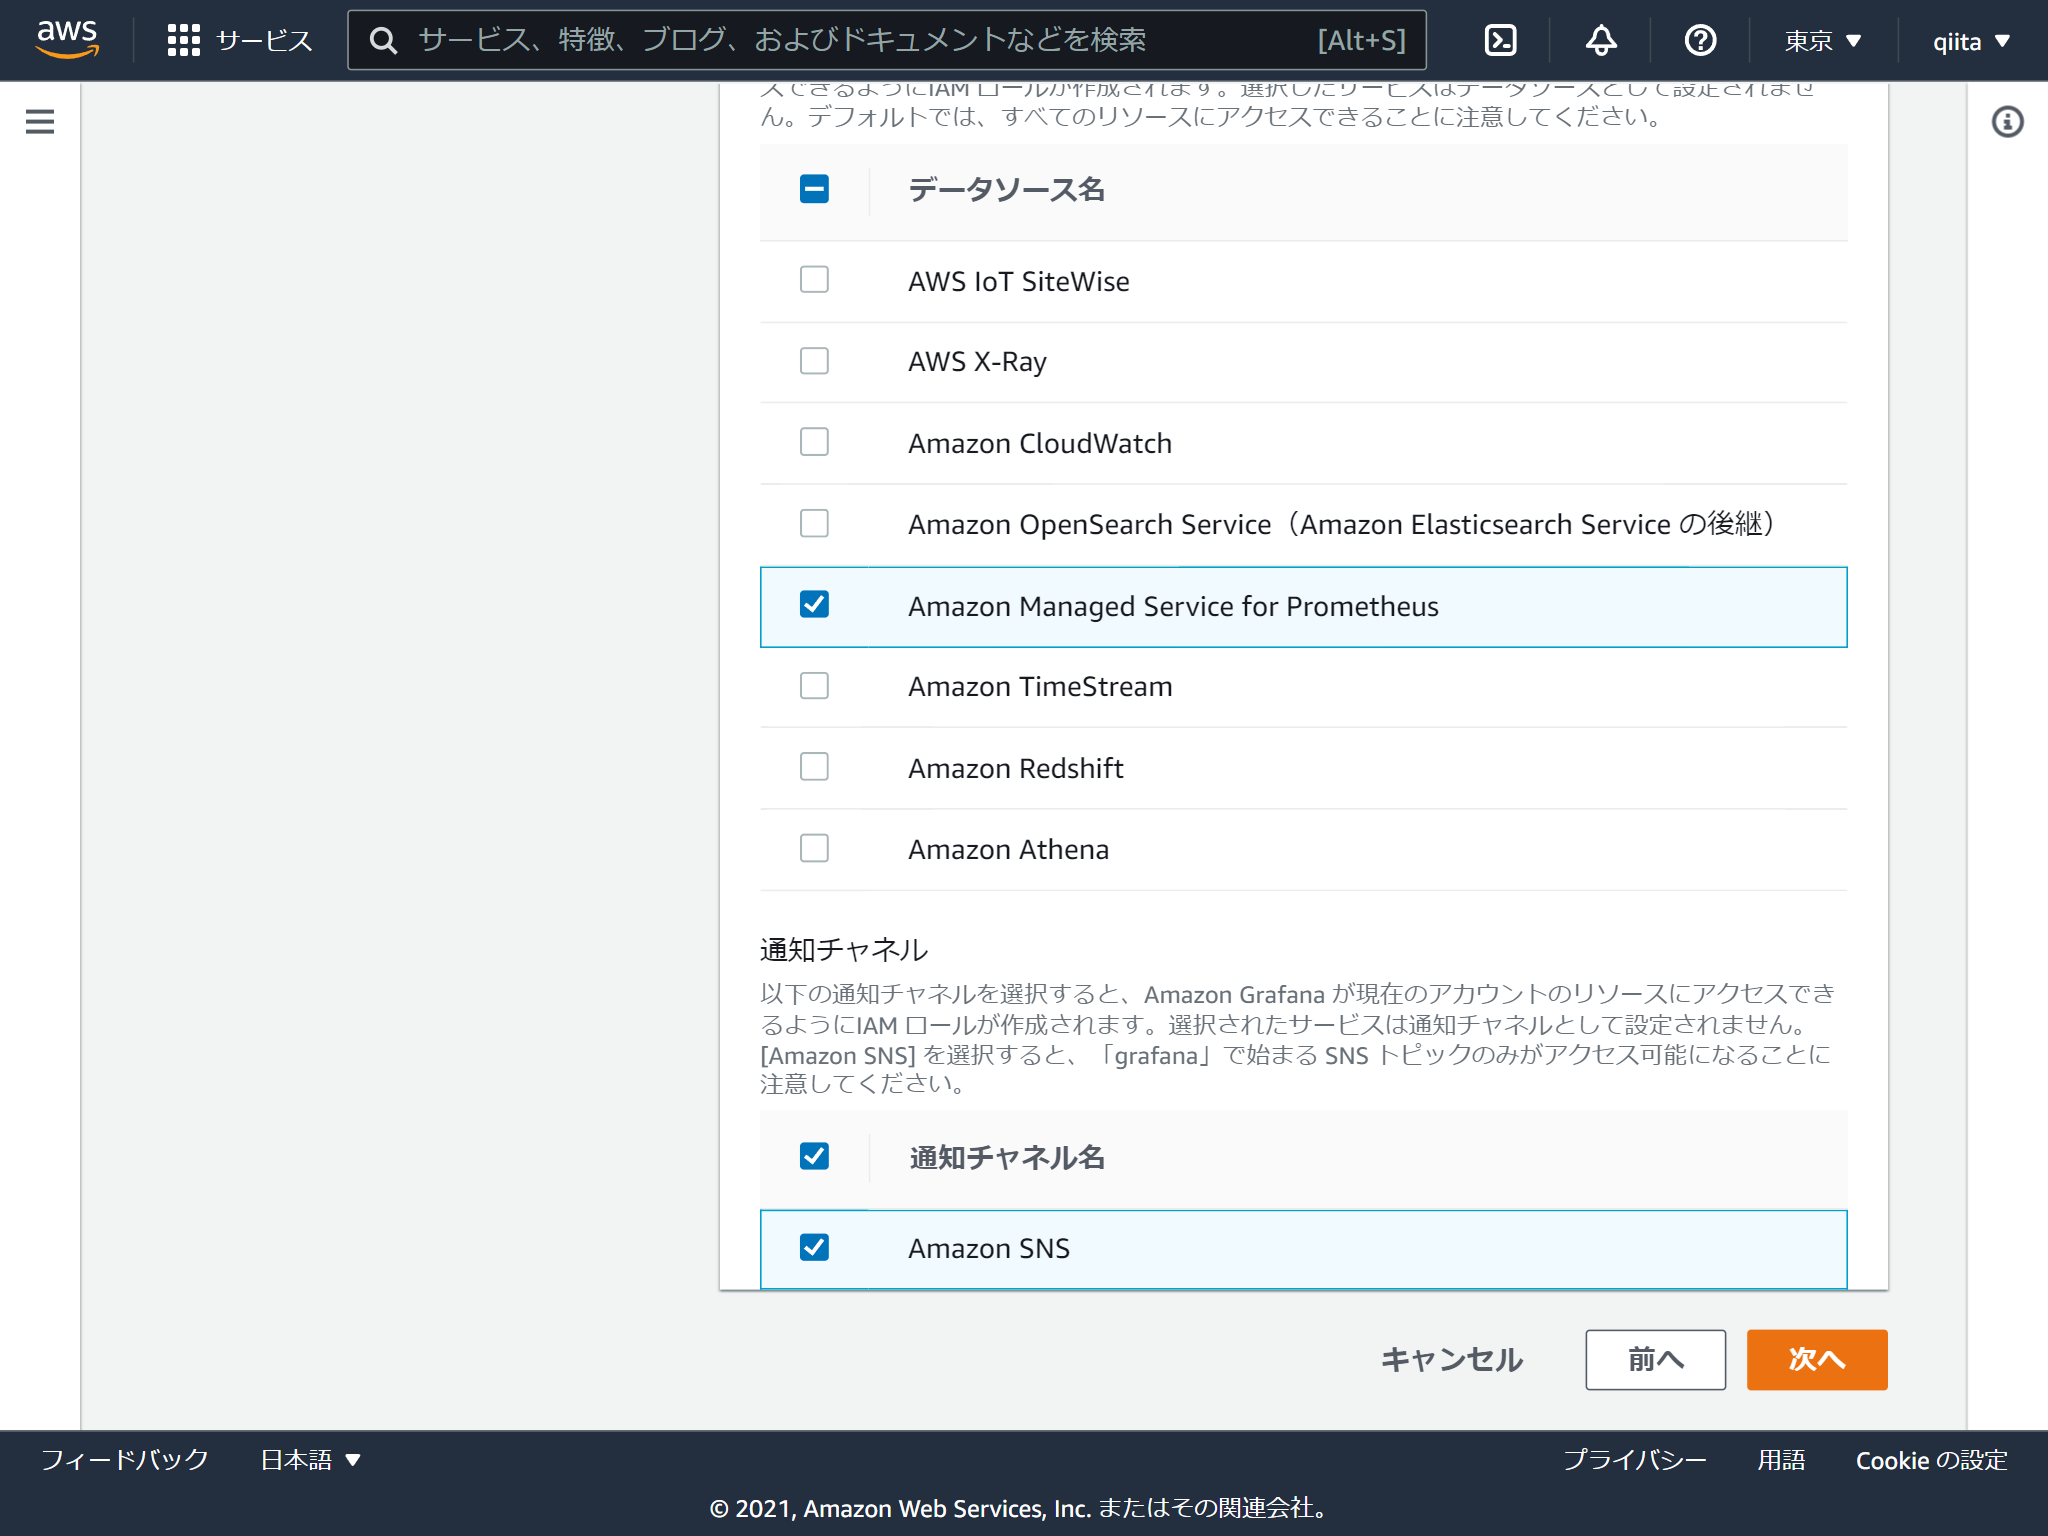
これで作成は完了です。 続いてログインするユーザーを追加します。「ユーザーとユーザーグループの設定」をクリック
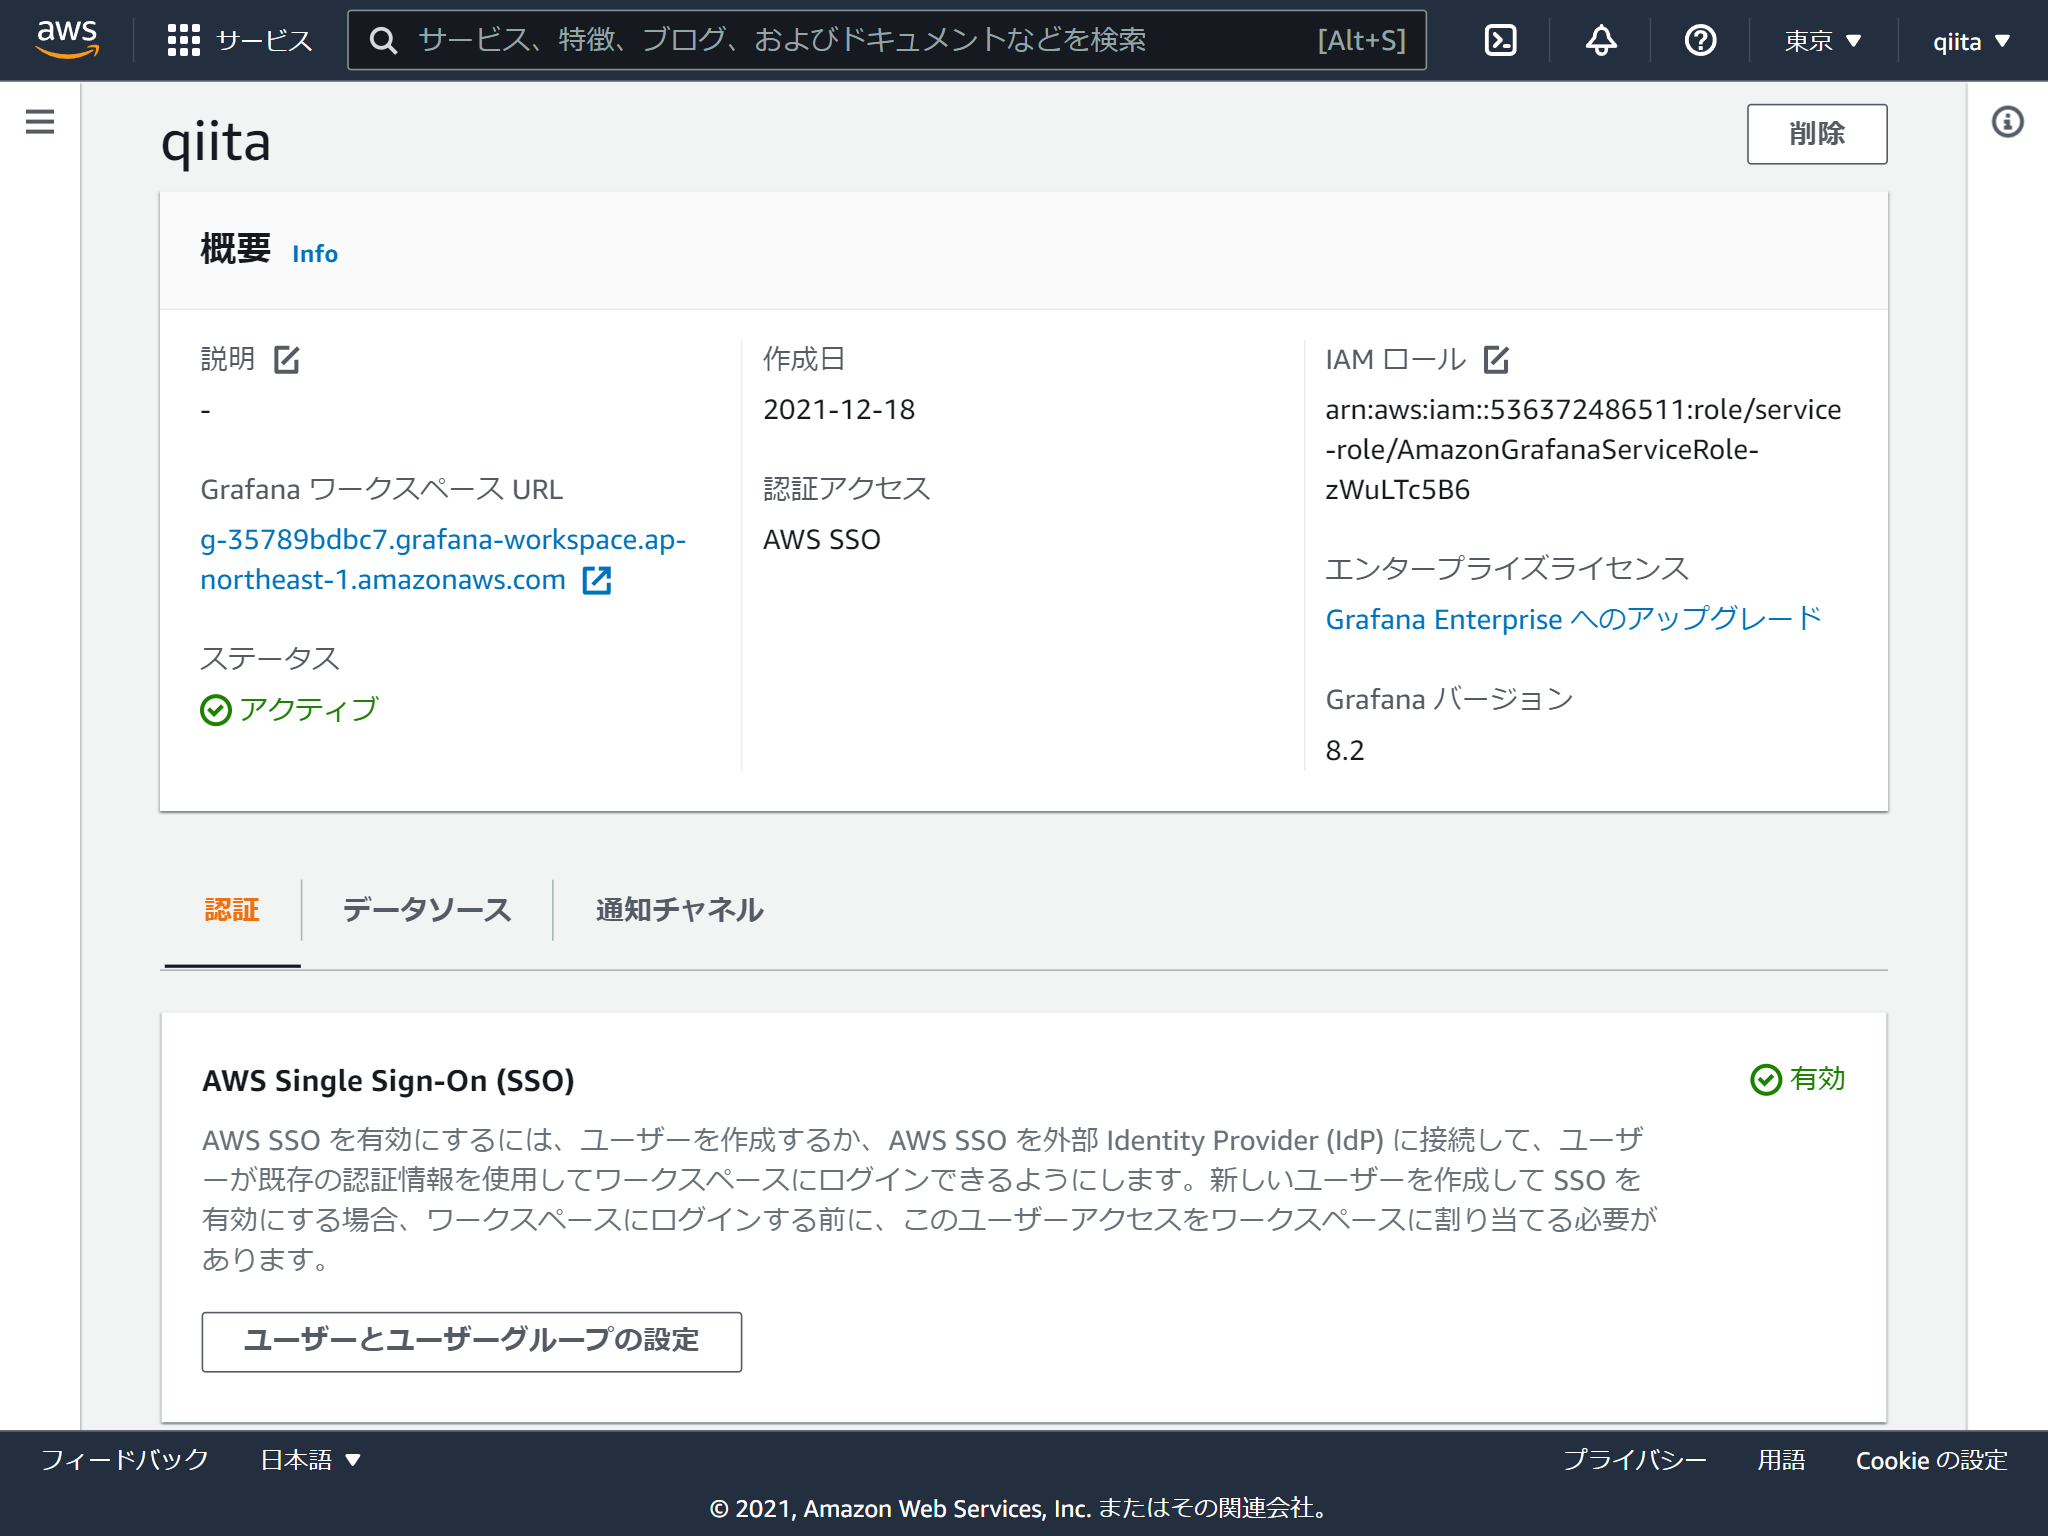
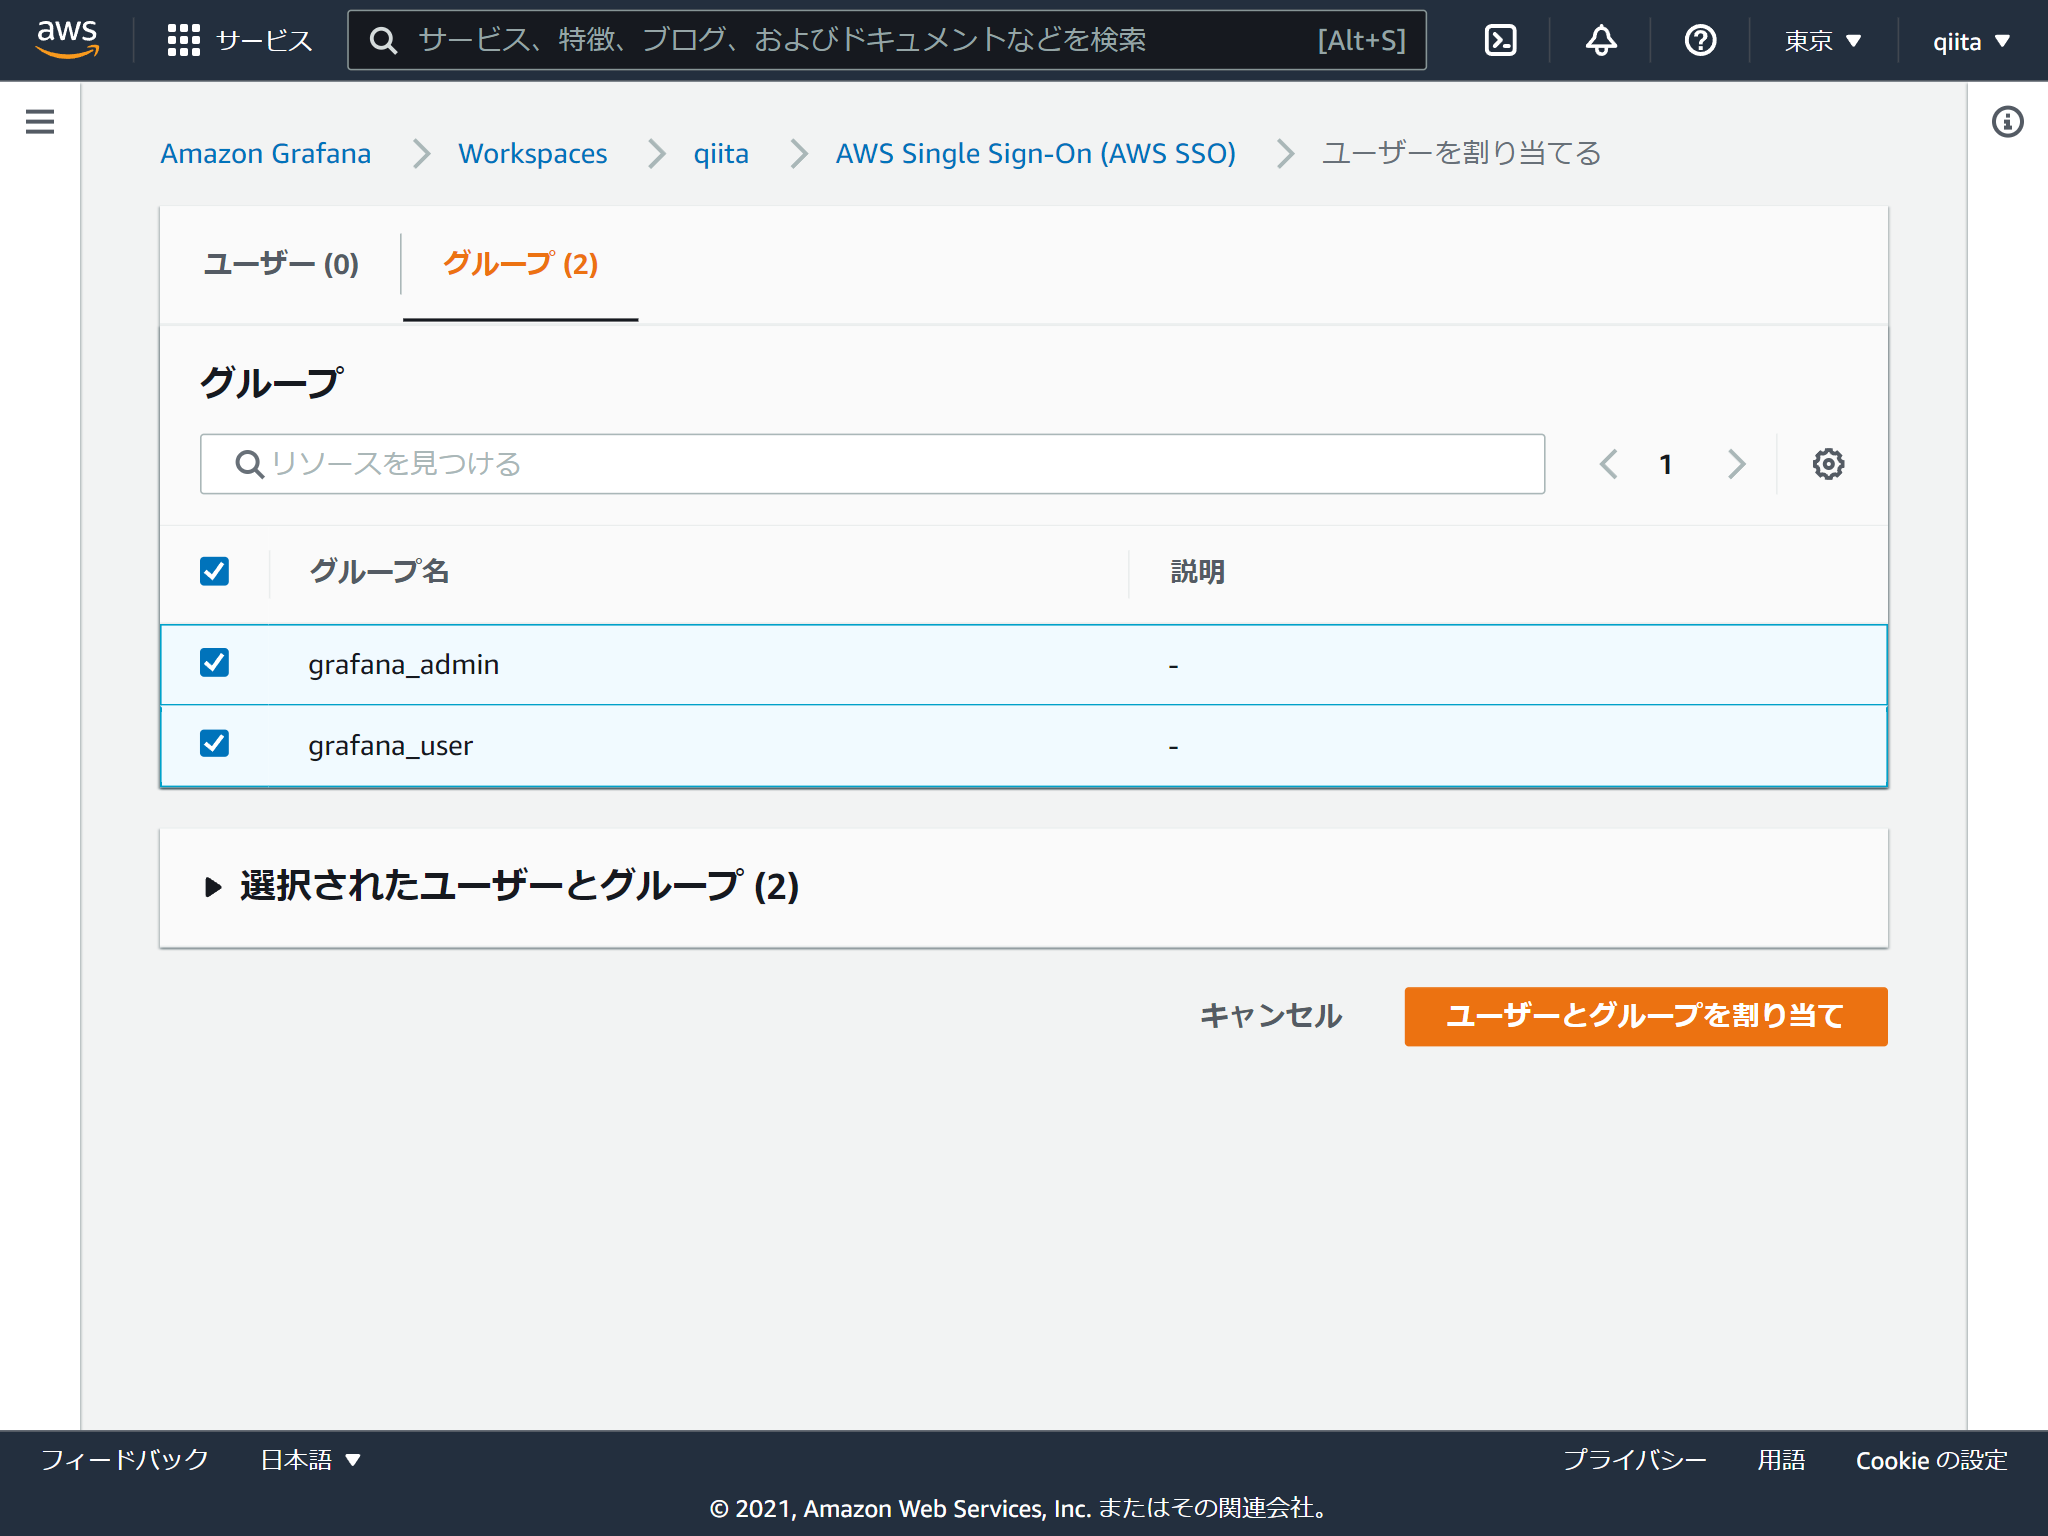
今回はAWS SSOで作成したグループを追加します。
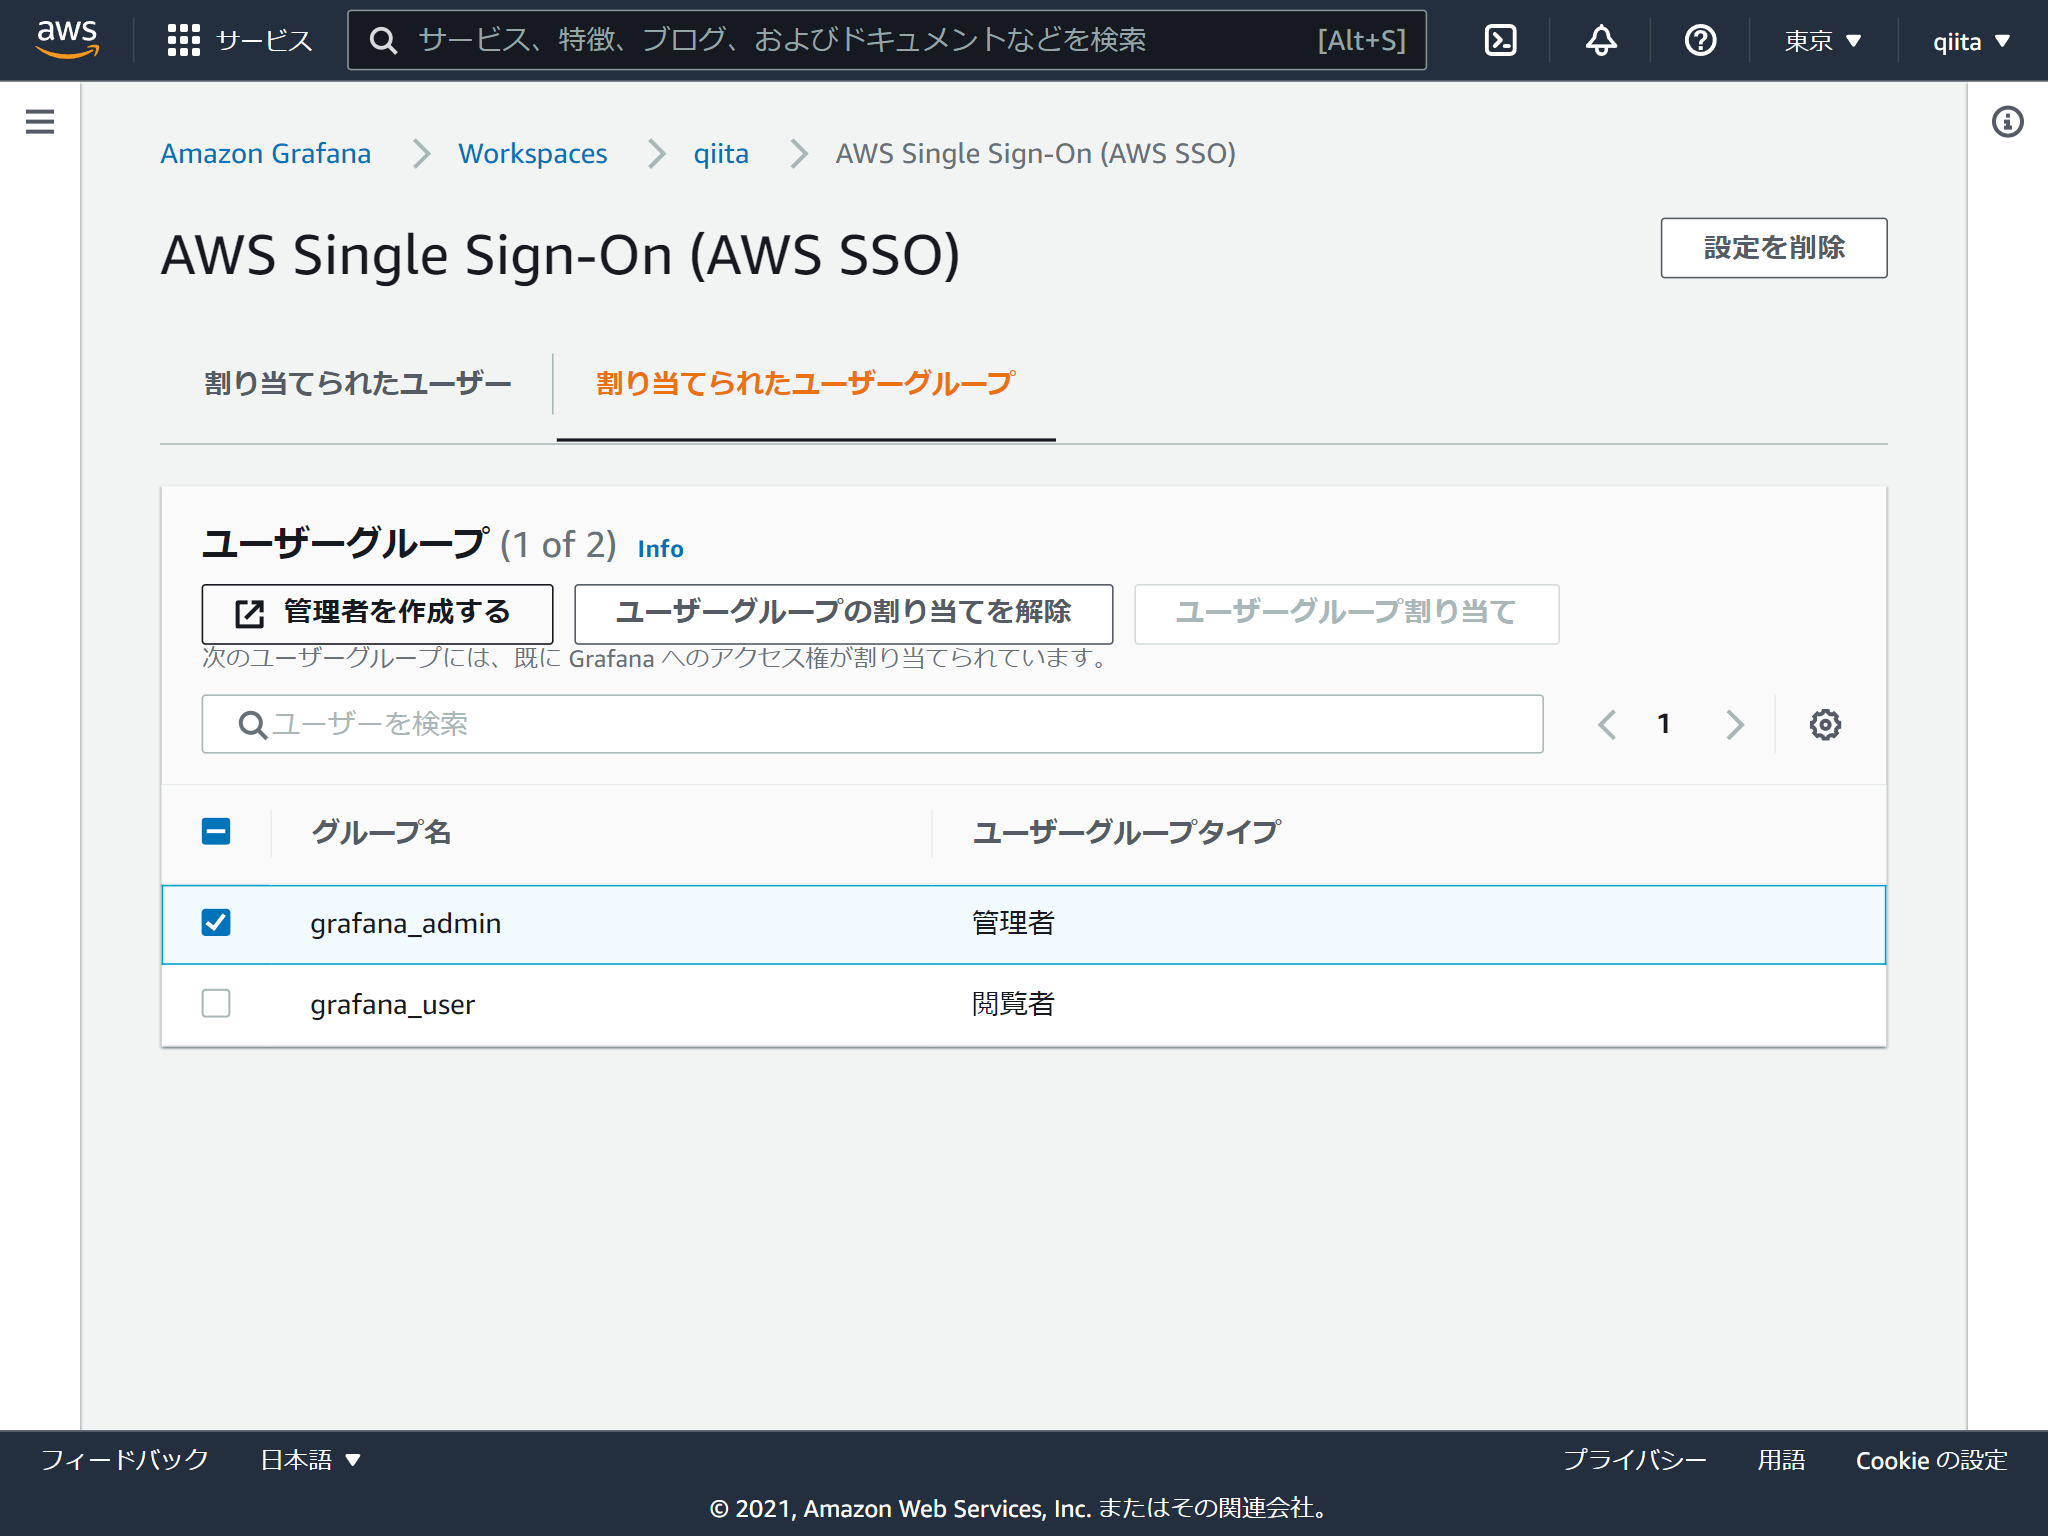
権限は閲覧者と管理者の2つあります。デフォルトが閲覧者で管理者に変更する場合はチェックを入れて「管理者を作成する」をクリックします。(閲覧者に戻す方法はないのかな?)
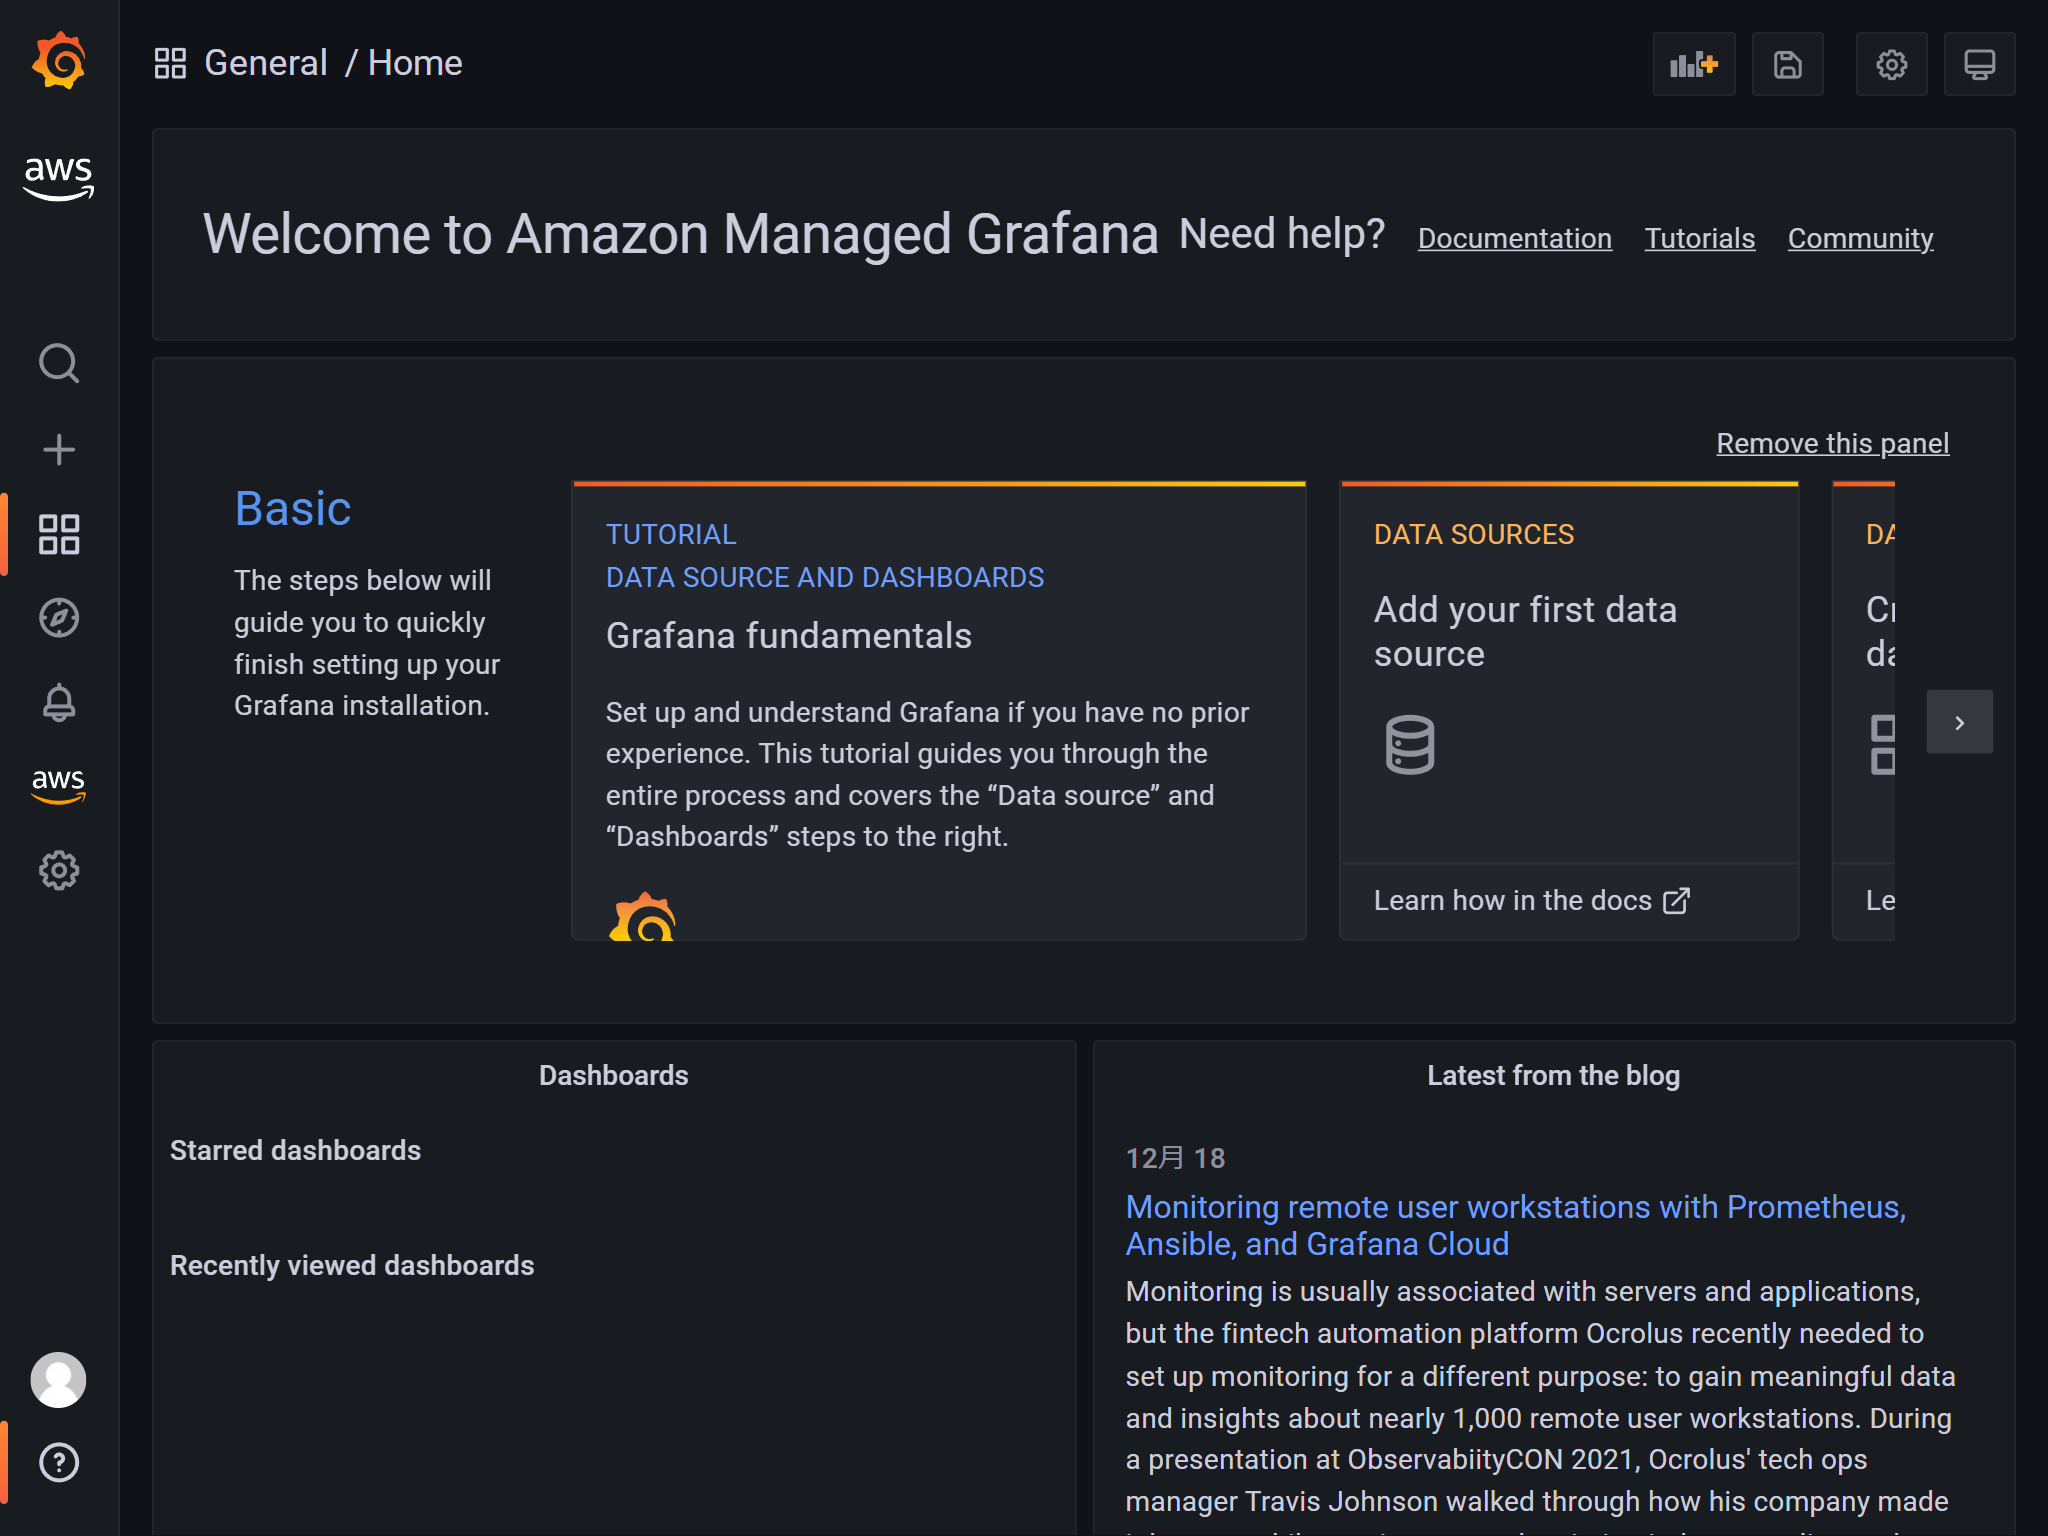
Grafanaログイン
マネジメントコンソールに表示されるワークスペースURLからアクセスします。設定したAWS SSOのユーザーでログインするとGrafanaの画面が表示されます。メニューにAWSのアイコンがありますね。
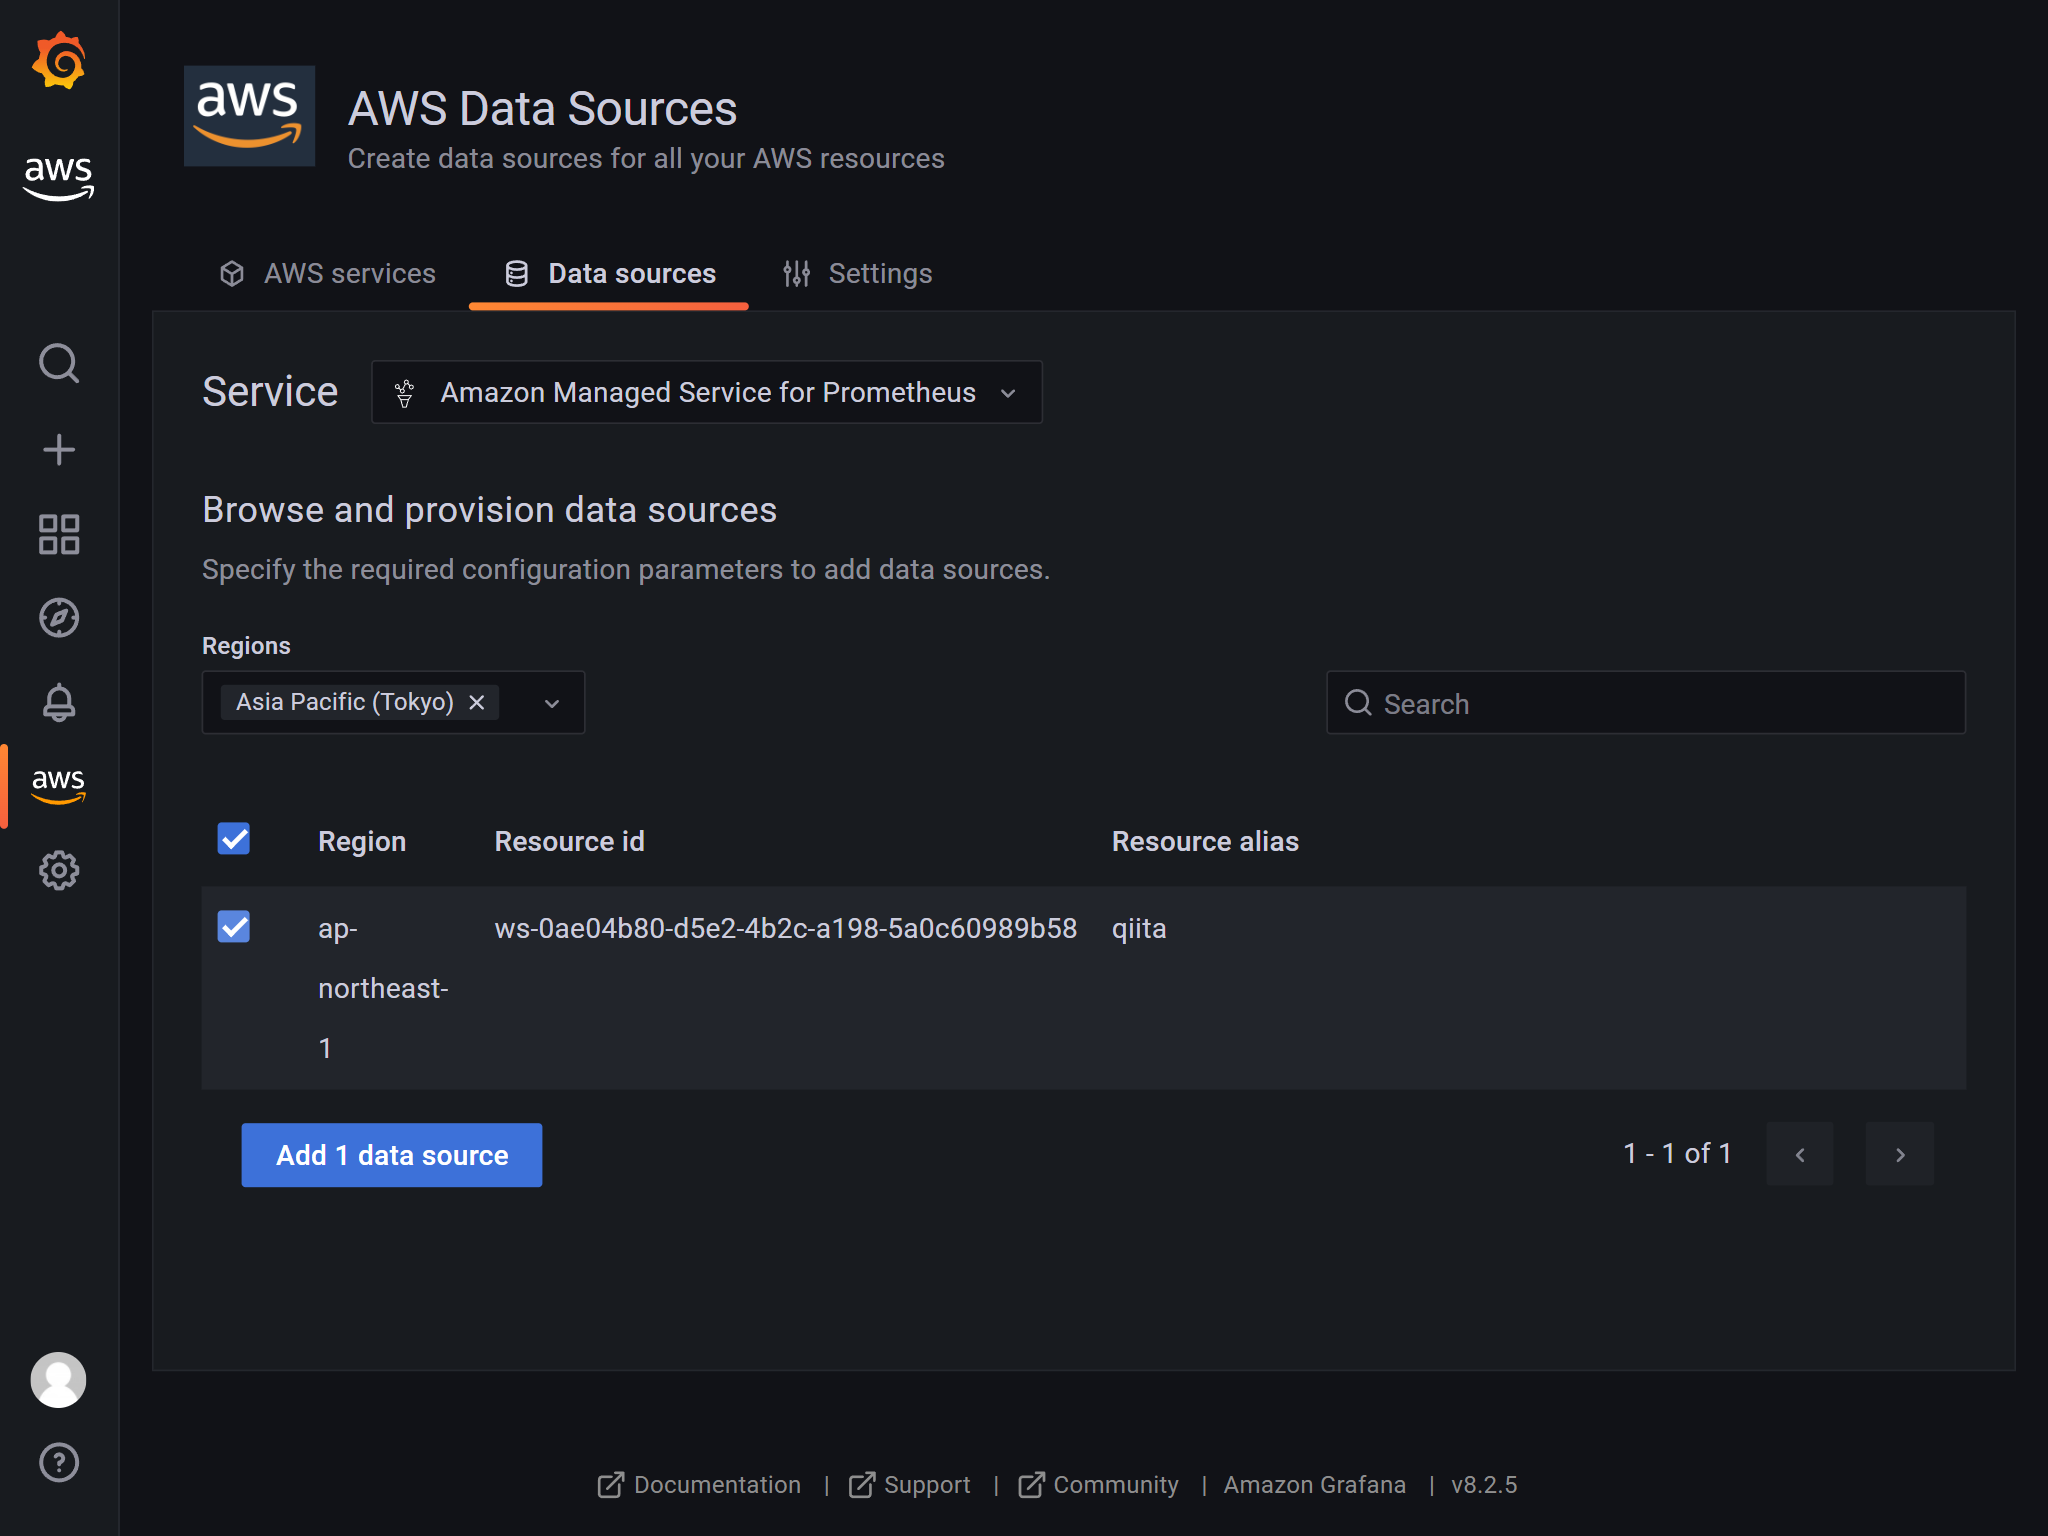
データソースにAmazon Managed Service for Prometheusを追加します。 AWSアイコンからデータソースをたどると追加できます。
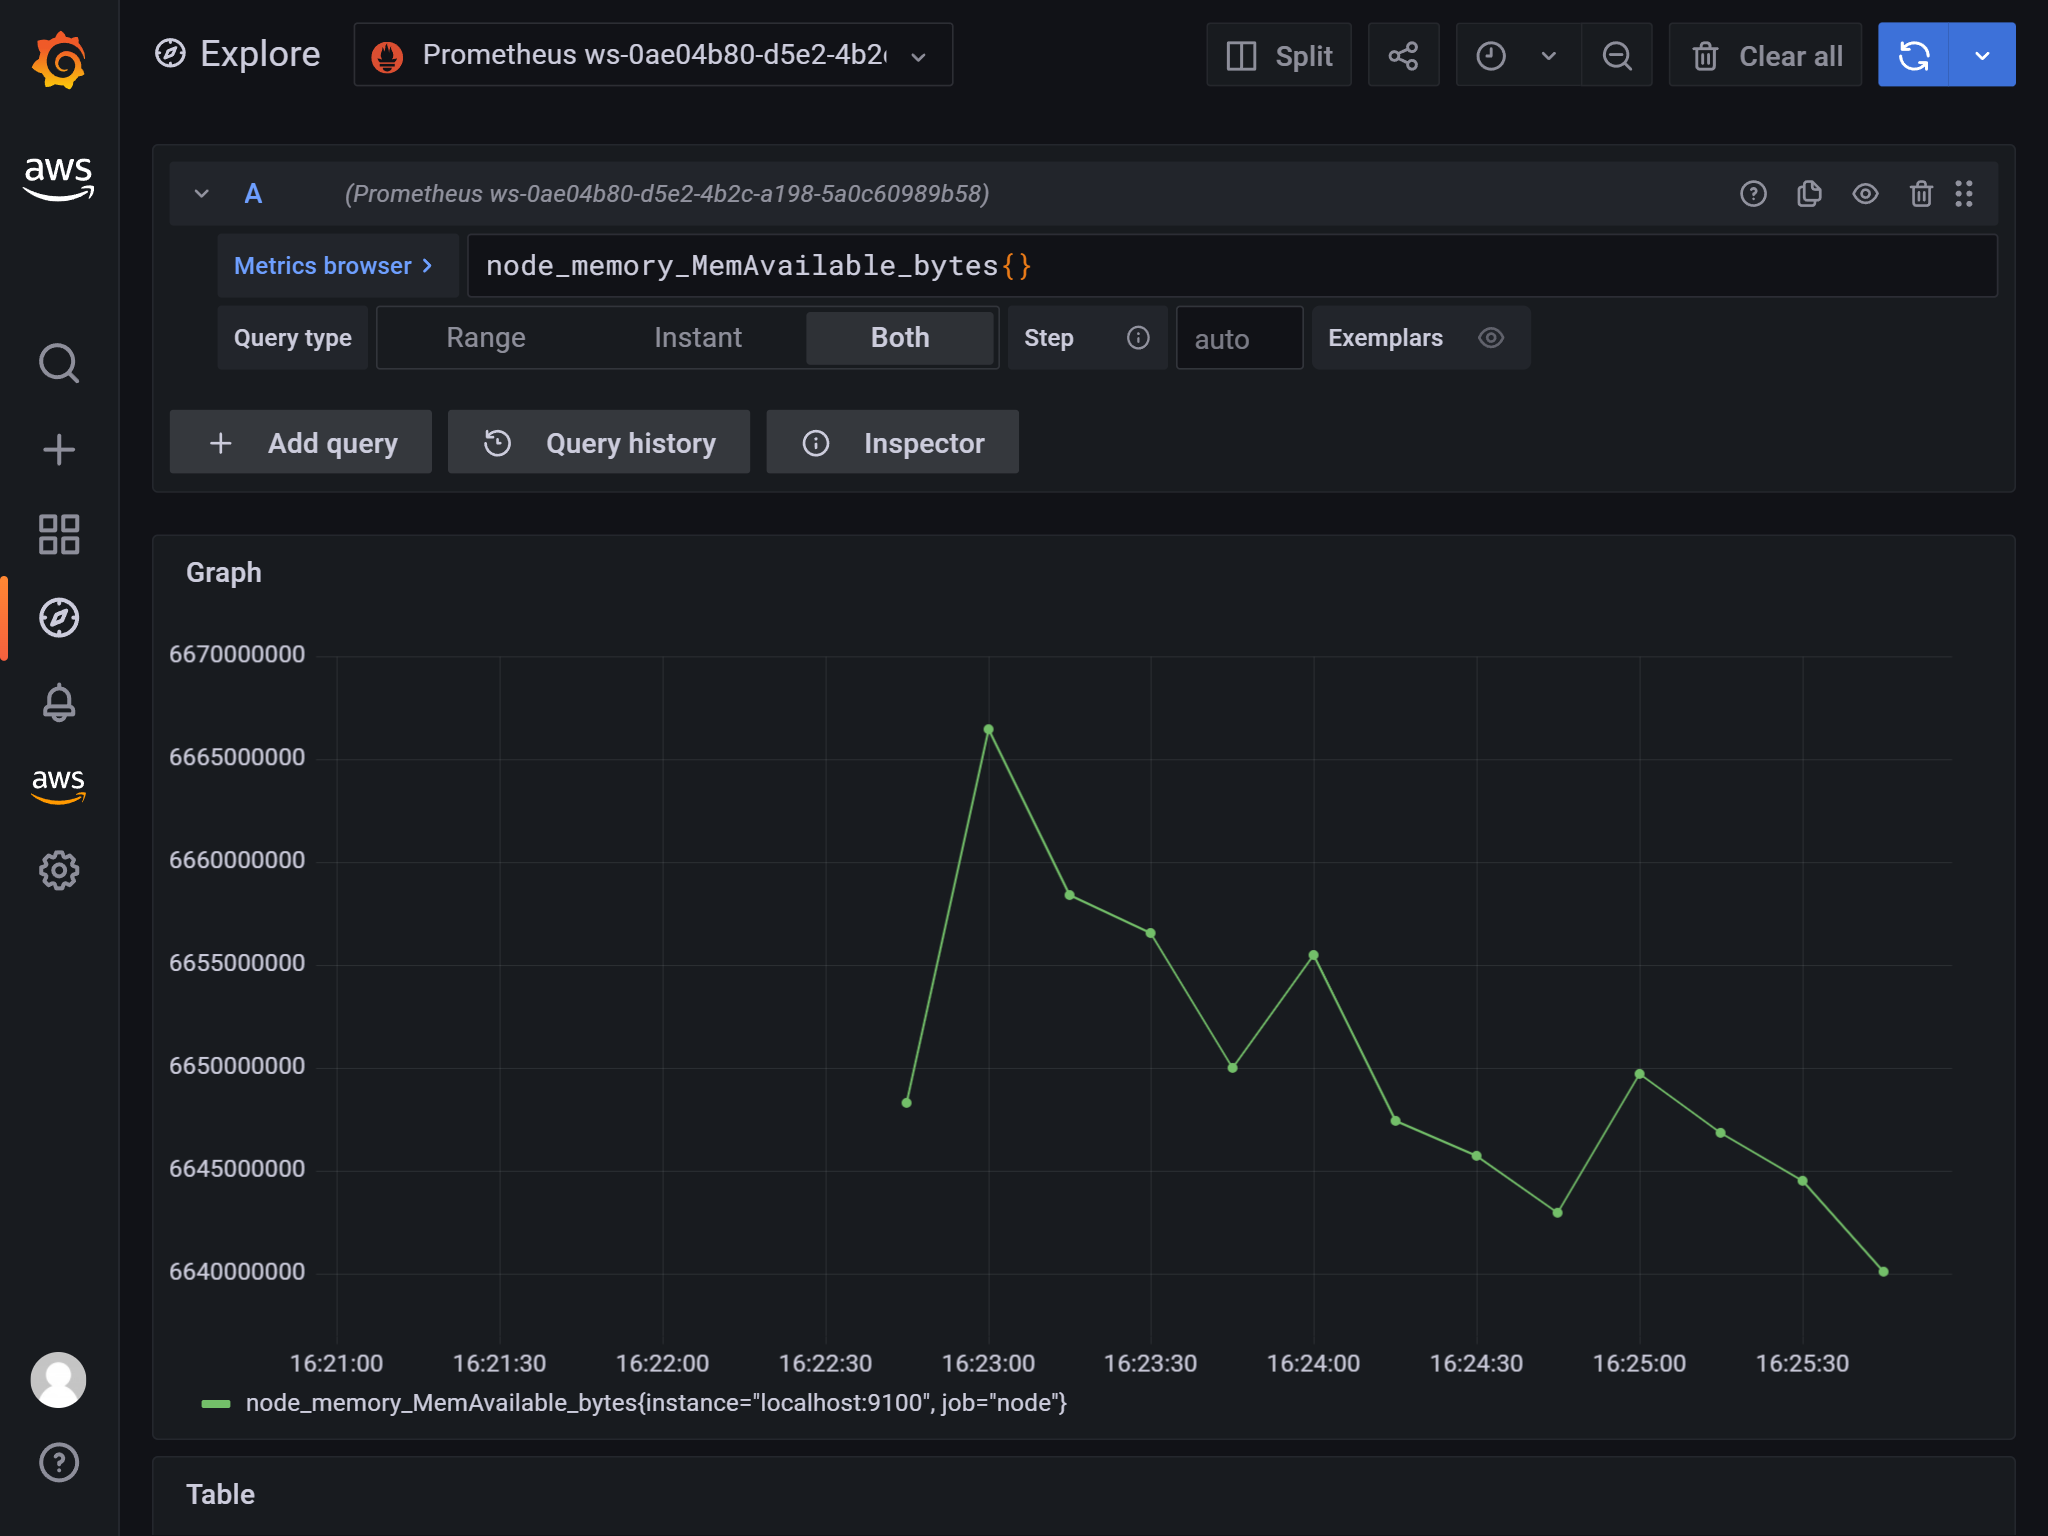
ここまでできれば通常のGrafana同様です。
GrafanaのRepeat optionsで繰り返しチャート表示
過去にQiitaに投稿した内容のアーカイブです。
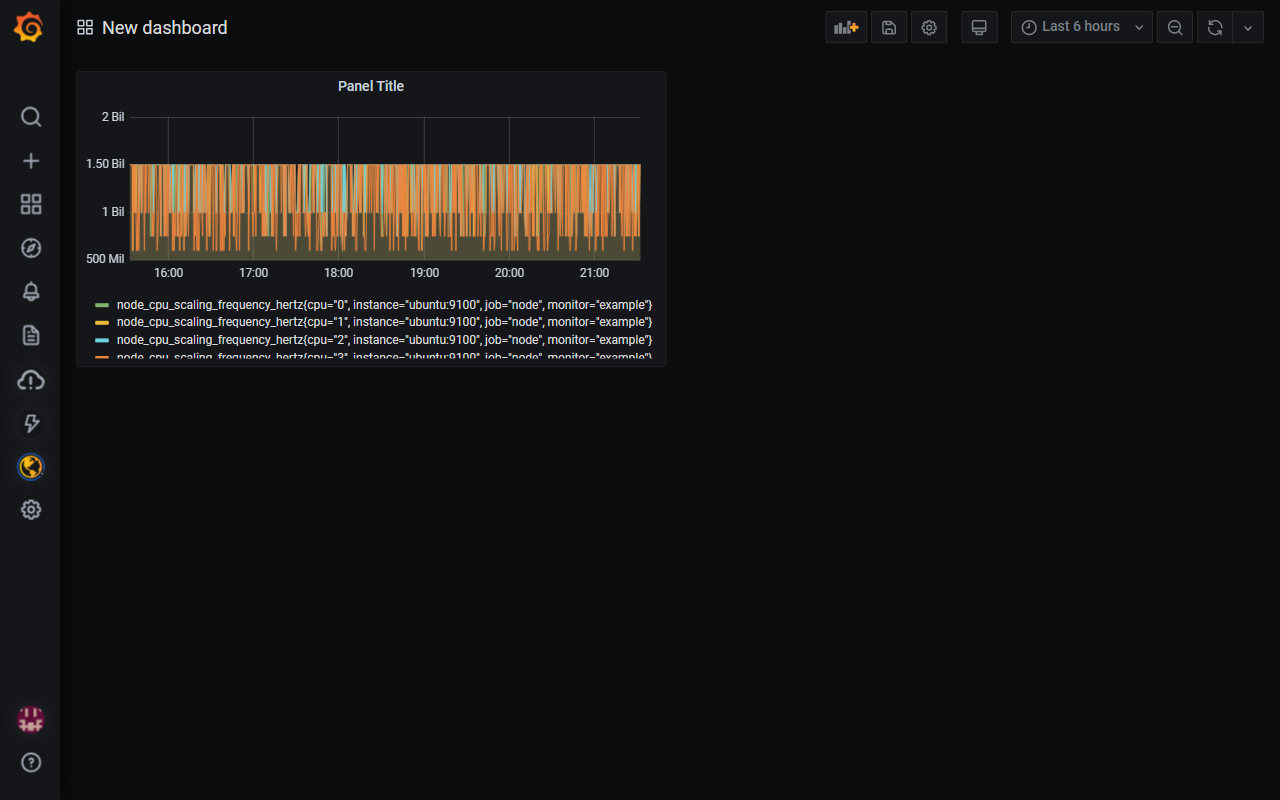
Raspberry PiにインストールしたPrometheusとNode exporterで取得したnode_cpu_scaling_frequency_hertzをGrafanaで可視化してみました。
設定無しでするとこんな感じ。
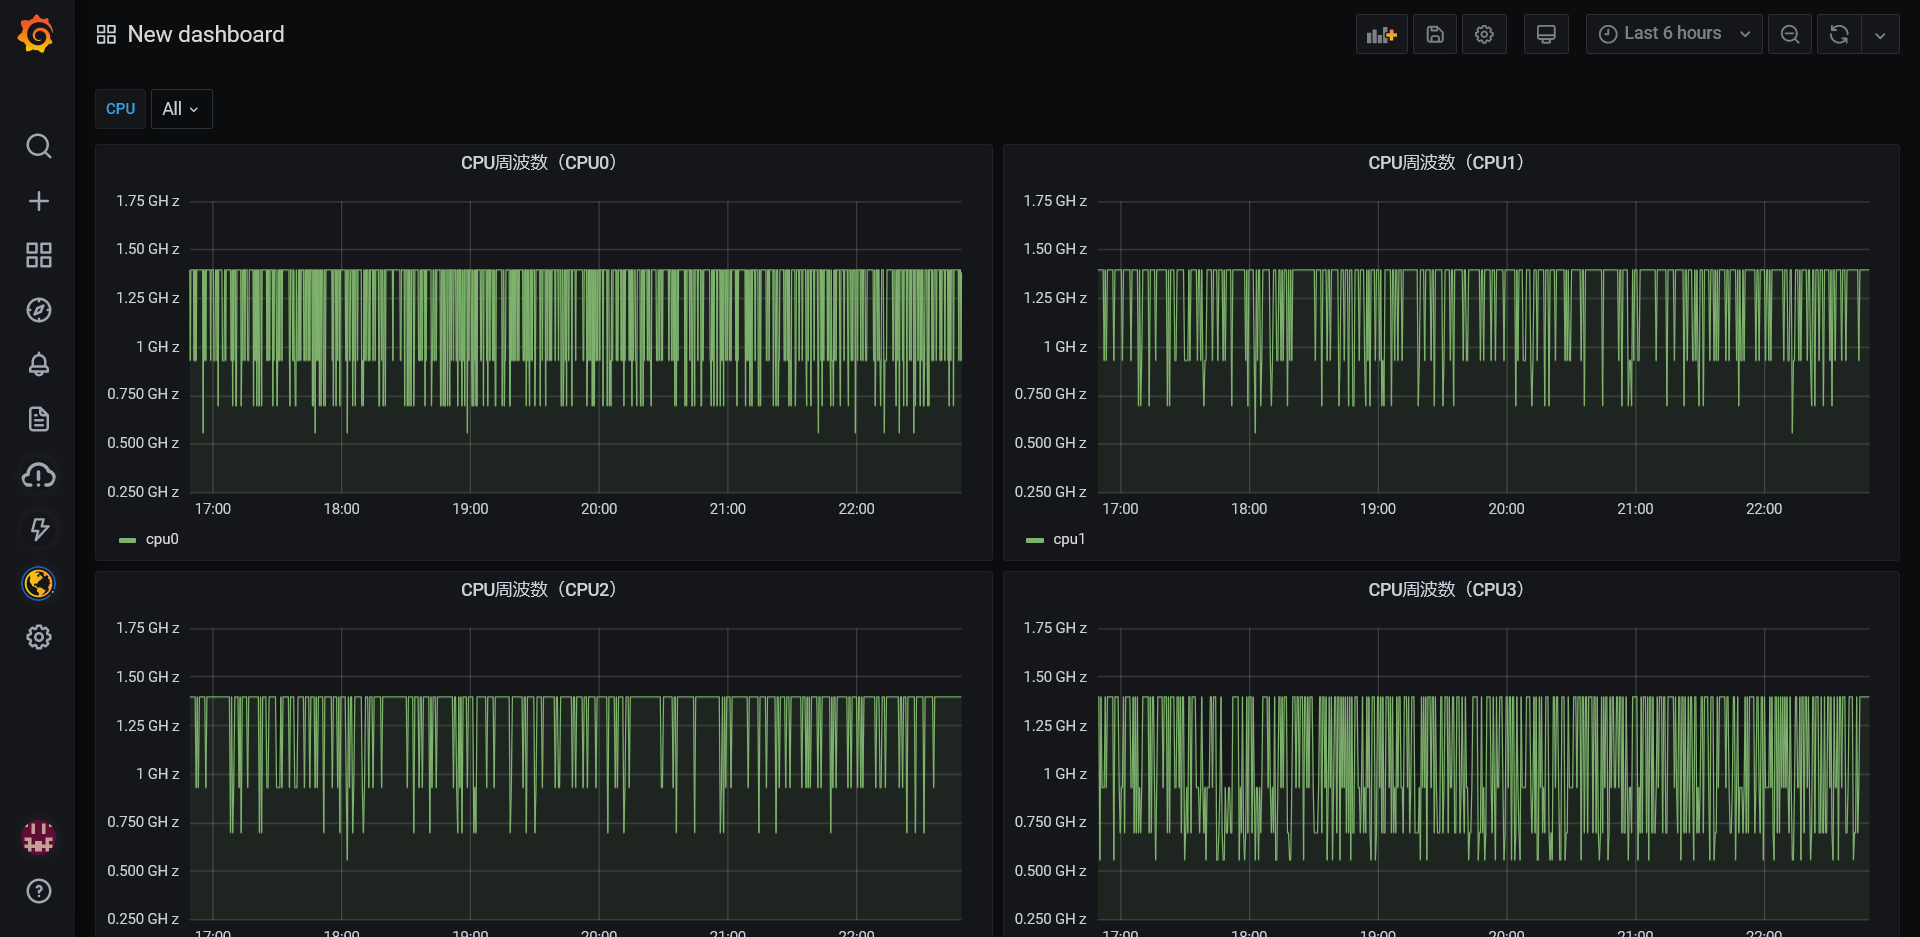
これを、CPUのコアごとのグラフにしてみたいと思います。
手順
Variableの追加
右上の設定ボタン(ギアアイコン)から、Variablesを追加します。
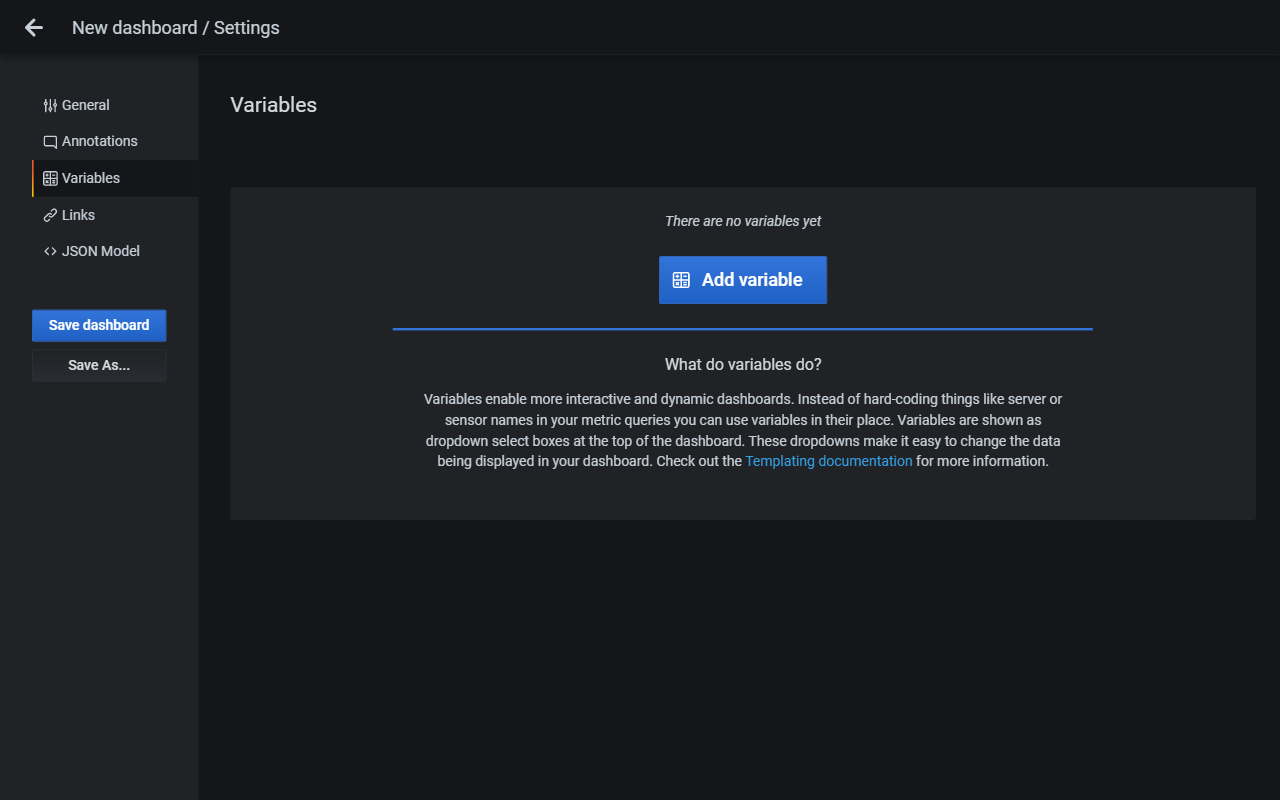
- General
| 項目 | 設定値 |
|---|---|
| Name | CPU |
| Type | Query |
- Query Options
| 項目 | 設定値 |
|---|---|
| Data Source | Prometeus |
| Refresh | On Dashboard Load |
| Query | label_values(node_cpu_scaling_frequency_hertz, cpu) |
| Sort | Alphabetical (asc) |
- Selection Options
| 項目 | 設定値 |
|---|---|
| Multi-value | 有効 |
| Include All option | 有効 |
Panelの設定
QueryのMetricsはこんな感じです。
| 項目 | 設定値 |
|---|---|
| Metrics | node_cpu_scaling_frequency_hertz{cpu="$CPU"} / 1024 / 1024 / 1024 |
| Legend | cpu{{cpu}} |
※/ 1024 / 1024 / 1024の部分は単位をGHzにしているだけですのであまり本題とは関係ありません。
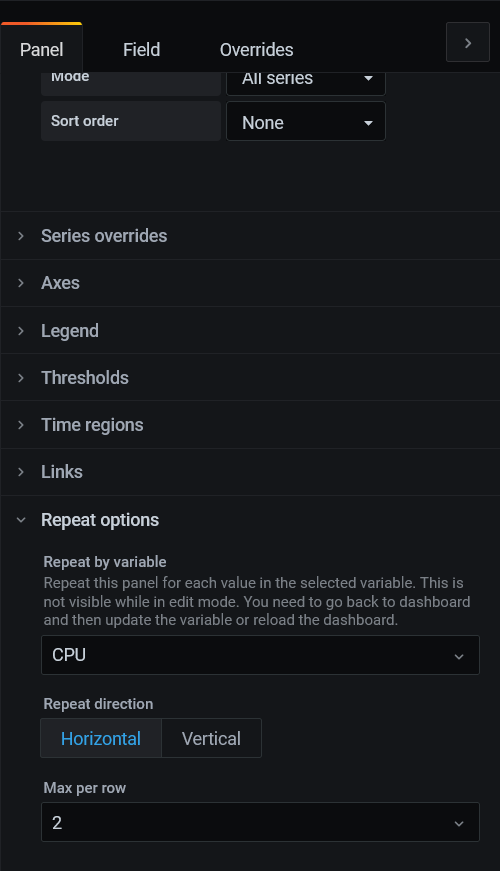
右側のPanel設定の一番下にRepeat optionsがあります。ここにVariableで追加したものが選択できます。
(選択肢が出ないときは右上のApplyを一度押すといいかもしれません)
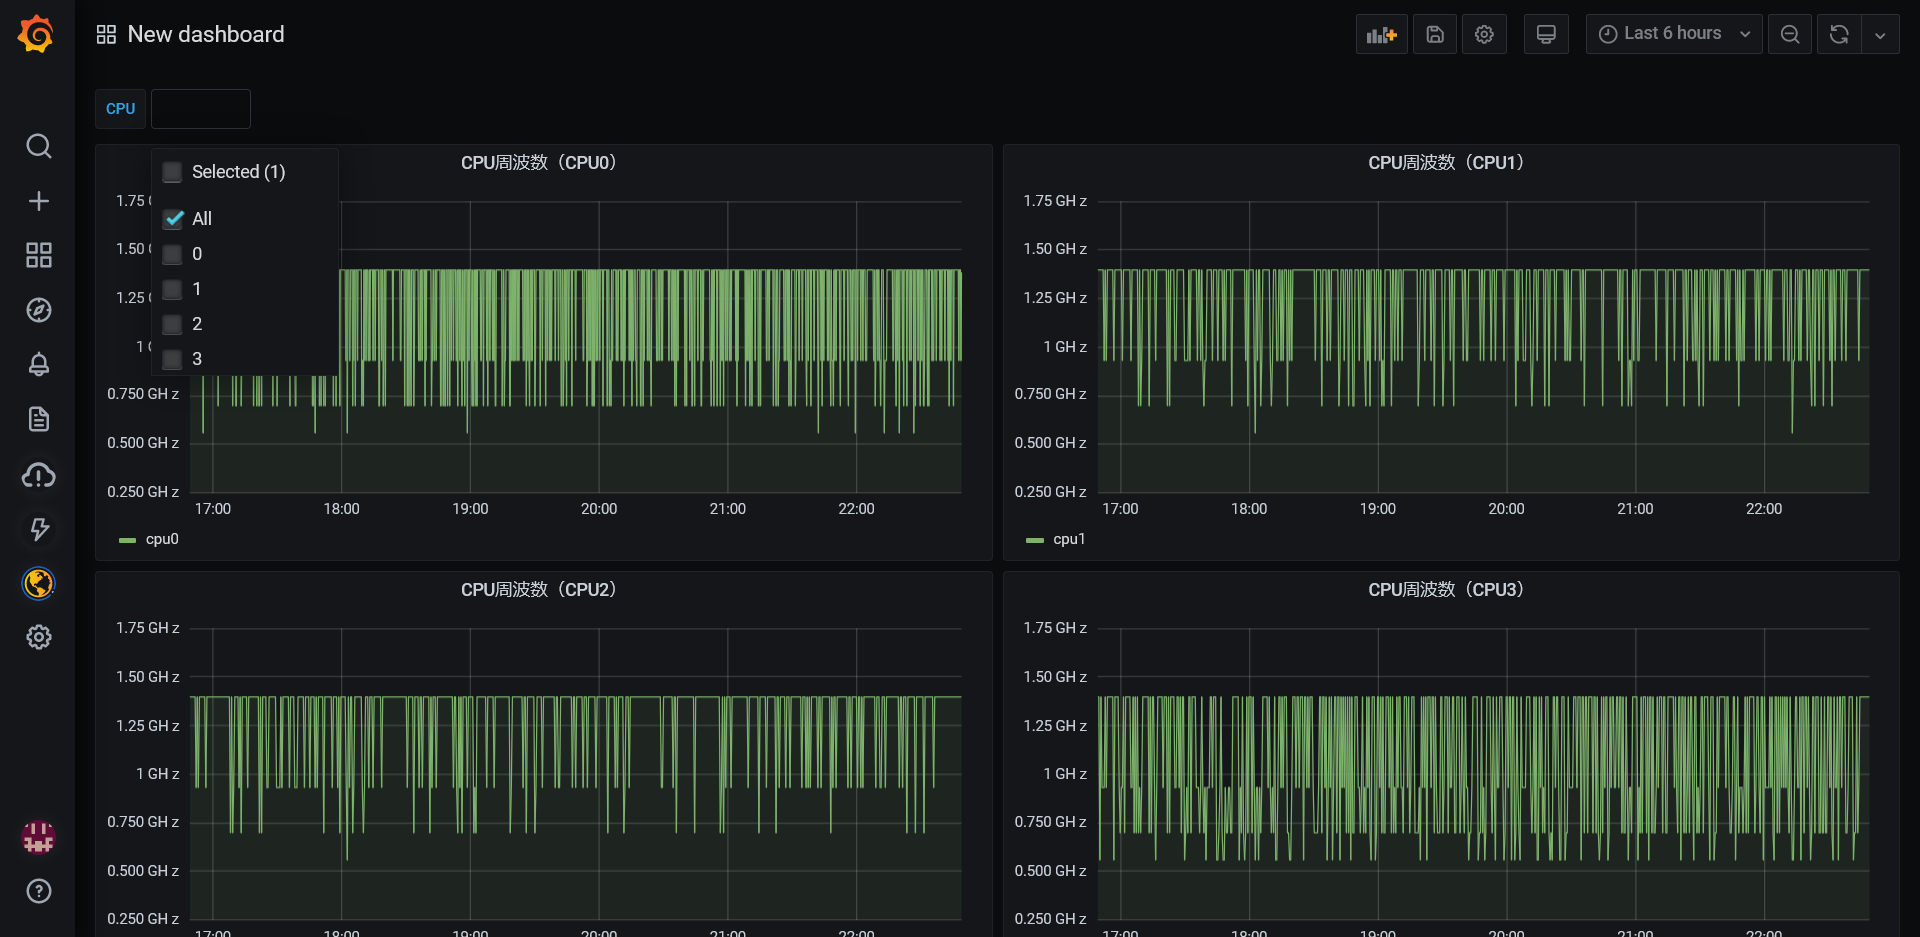
Variablesの設定をしたので、画面上部に選択肢が出てくるようになりました。
表示をGaugeにしたらこんな感じです。
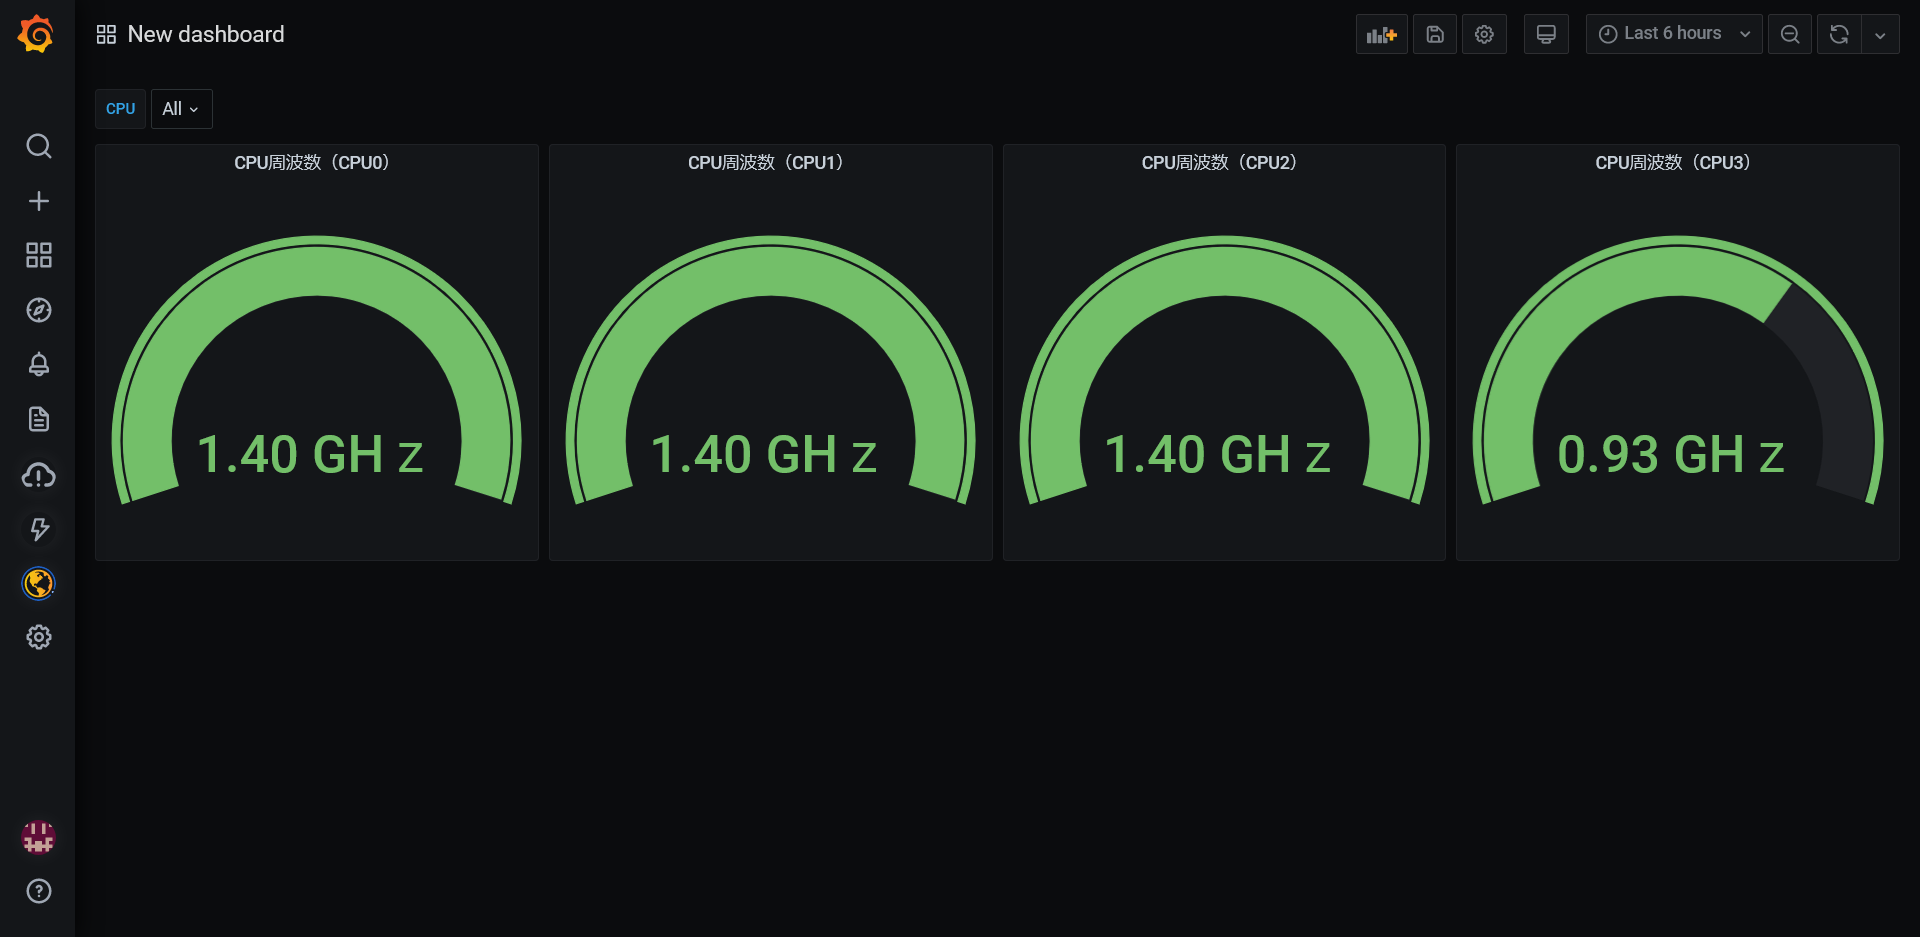
CPUコアごとの表示というのはあまり用途は無いですが、監視対象の全ホストのCPU利用率を一覧で見るなどは使いみちがあるかと思いました。
Raspberry PiのCPU温度をPrometheus+Grafanaで可視化する
過去にQiitaに投稿した内容のアーカイブです。
Raspberry Pi4が熱い。やけどしそうです。 CPU温度をGrafanaで可視化してみます。
- 2020/8/16時点のRaspberry Pi OSは
Debian Busterがベース - Busterのリポジトリに登録されている
prometheus-node-exporterのバージョンは0.17.0。 - Busterの次のバージョン
Bullseyeのリポジトリにはバージョン1.0.1があり、これを使うとCPU温度の値が取れる
PrometheusとGrafanaのインストールについては、以前書いた「PrometheusとGrafanaでRaspberry Piを監視」を参照ください。
バージョン1.0.1のprometheus-node-exporterをインストール
- https://www.debian.org/distrib/packages#search_packages でprometheus-node-exporterを検索
- 検索結果の
prometheus-node-exporter パッケージのbullseye (testing)をクリック - ページ下部にある
prometheus-node-exporter のダウンロードのarm64かarmhfを選択 ftp.jp.debian.orgで始まるリンクをクリックし、debパッケージをダウンロードsudo dpkg -i prometheus-node-exporter_[バージョン]_[アーキテクチャ].debでインストール
Grafanaで可視化
CPU温度はnode_thermal_zone_tempというメトリクスで取得されています。
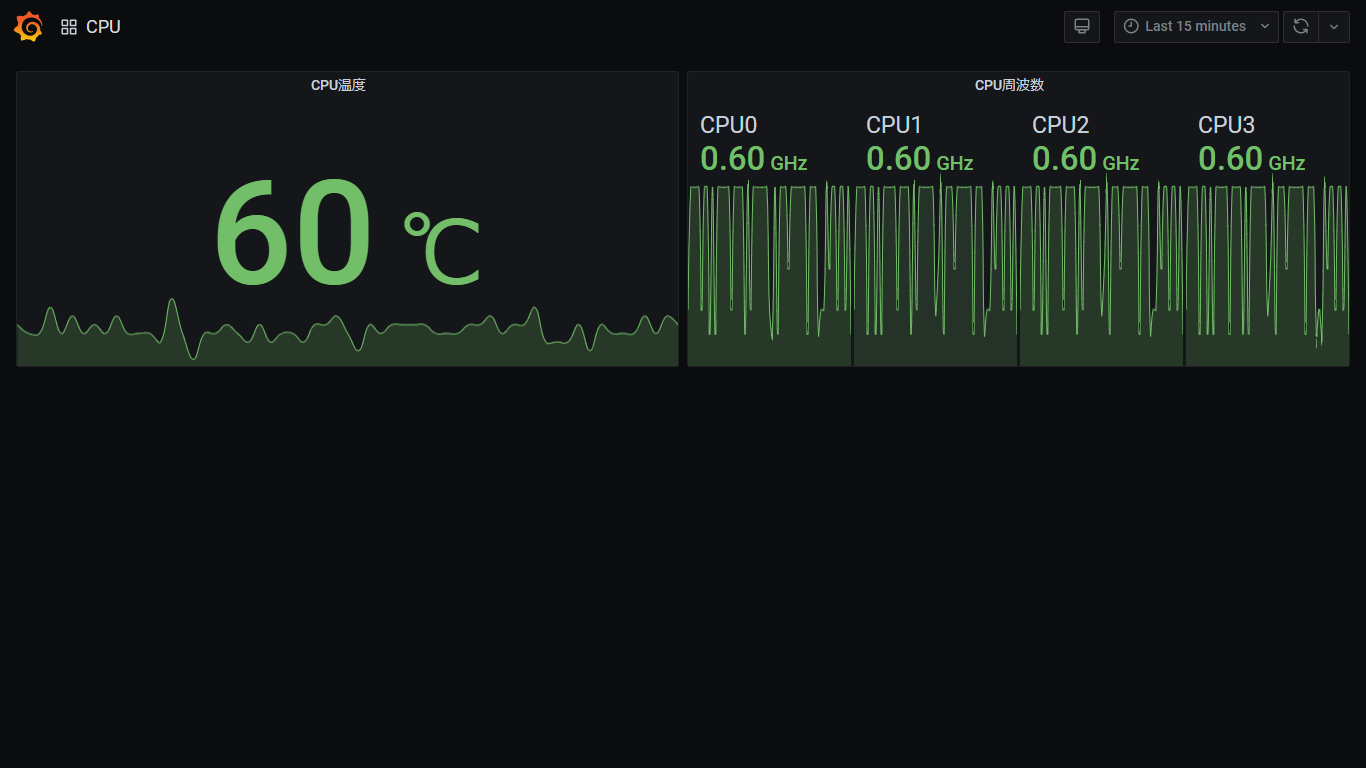
私はCPUの周波数と合わせて、こんな感じで可視化してみました。
熱い