Raspberry PiにインストールしたPrometheusとNode exporterで取得したnode_cpu_scaling_frequency_hertzをGrafanaで可視化してみました。
設定無しでするとこんな感じ。
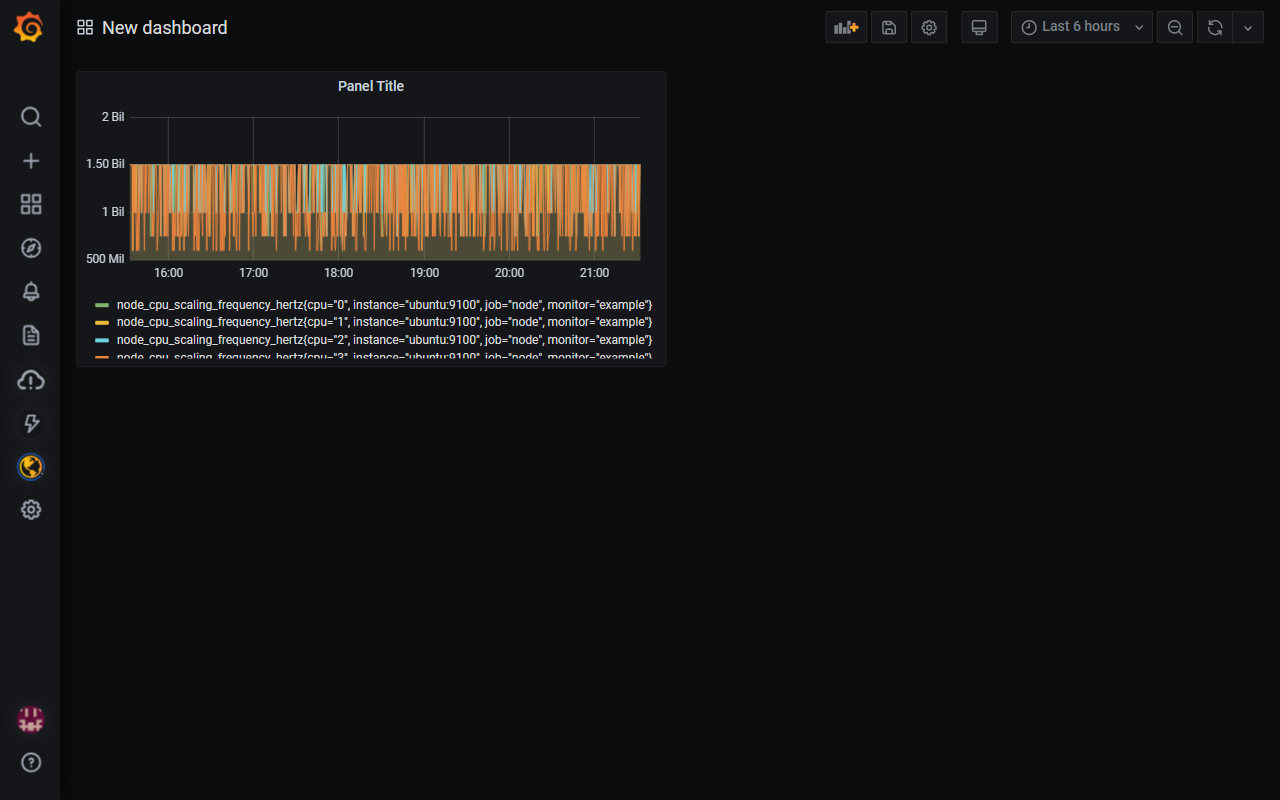
これを、CPUのコアごとのグラフにしてみたいと思います。
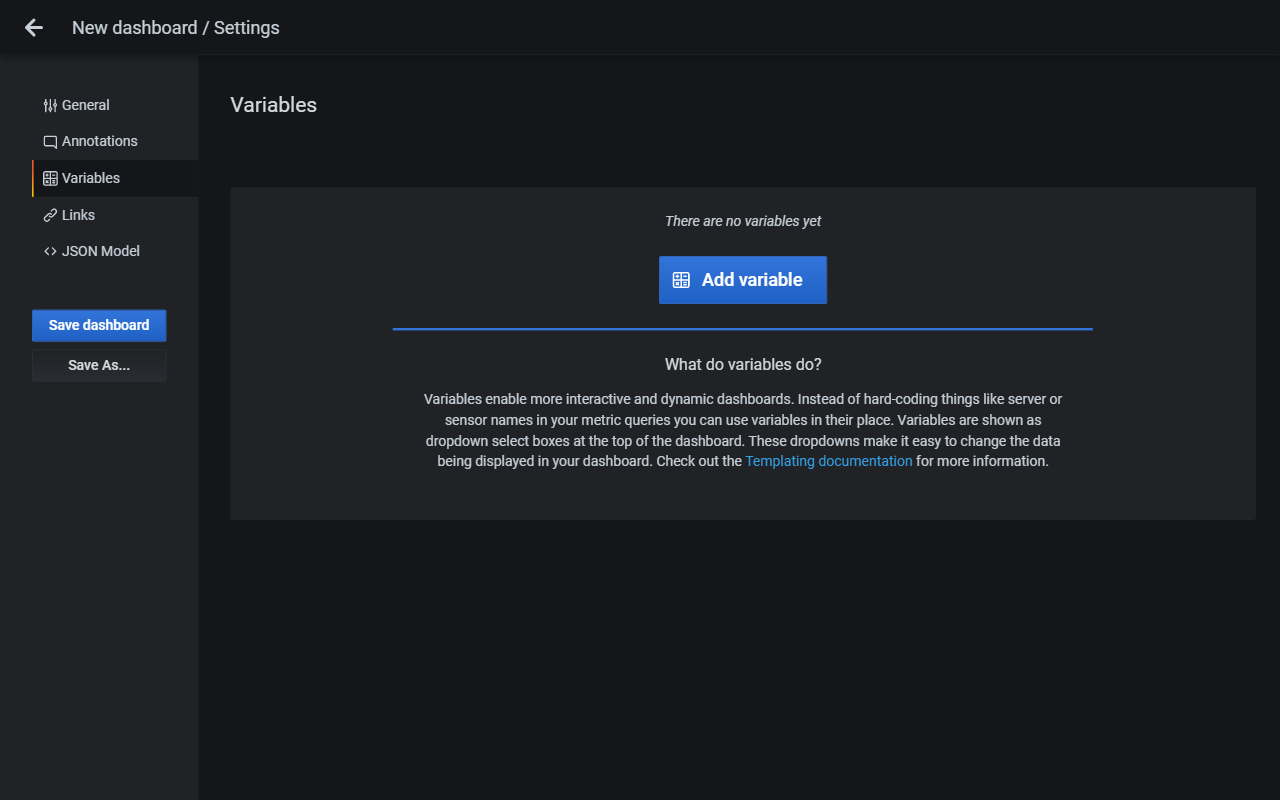
Variableの追加
右上の設定ボタン(ギアアイコン)から、Variablesを追加します。
| 項目 | 設定値 |
|---|
| Data Source | Prometeus |
| Refresh | On Dashboard Load |
| Query | label_values(node_cpu_scaling_frequency_hertz, cpu) |
| Sort | Alphabetical (asc) |
| 項目 | 設定値 |
|---|
| Multi-value | 有効 |
| Include All option | 有効 |
Panelの設定
QueryのMetricsはこんな感じです。
| 項目 | 設定値 |
|---|
| Metrics | node_cpu_scaling_frequency_hertz{cpu="$CPU"} / 1024 / 1024 / 1024 |
| Legend | cpu{{cpu}} |
※/ 1024 / 1024 / 1024の部分は単位をGHzにしているだけですのであまり本題とは関係ありません。

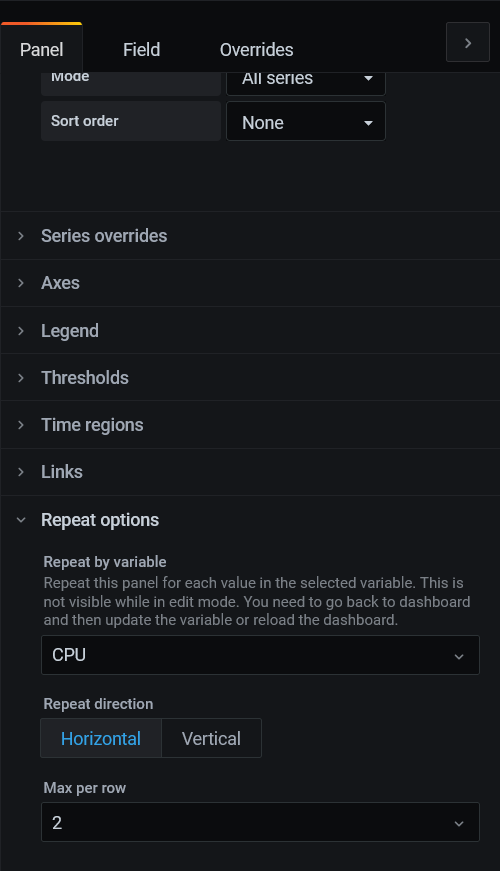
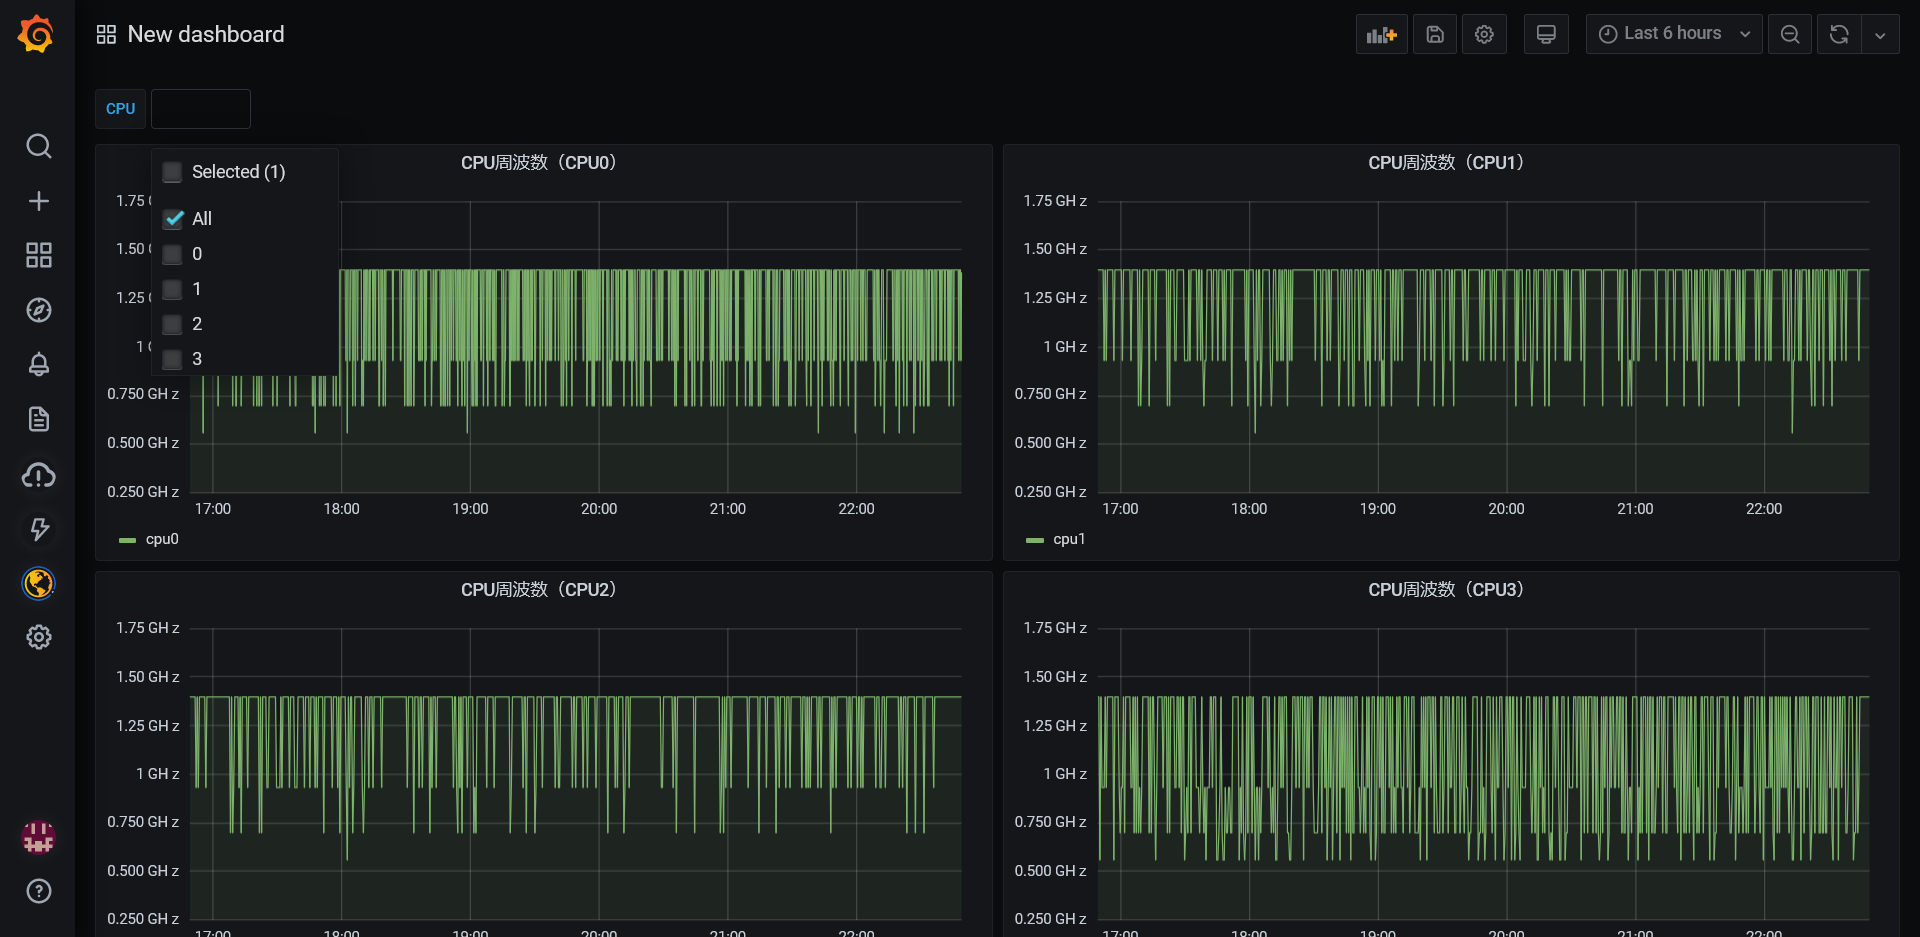
右側のPanel設定の一番下にRepeat optionsがあります。ここにVariableで追加したものが選択できます。
(選択肢が出ないときは右上のApplyを一度押すといいかもしれません)
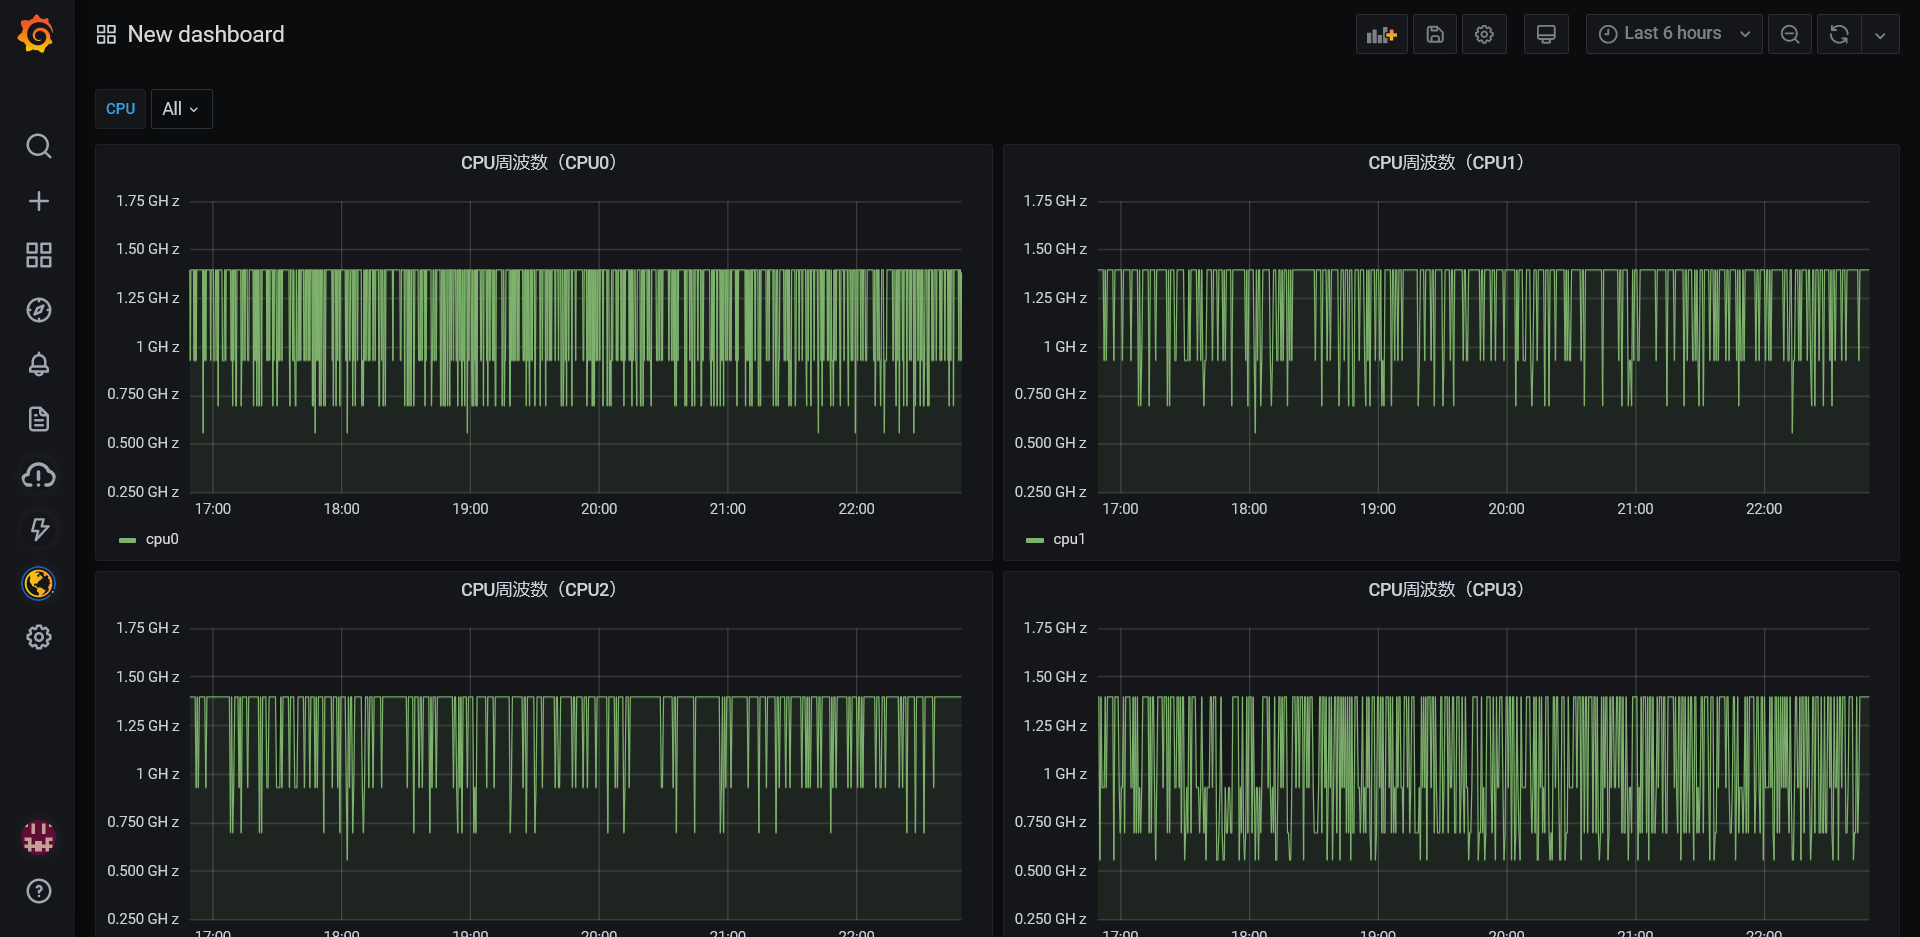
Variablesの設定をしたので、画面上部に選択肢が出てくるようになりました。
表示をGaugeにしたらこんな感じです。
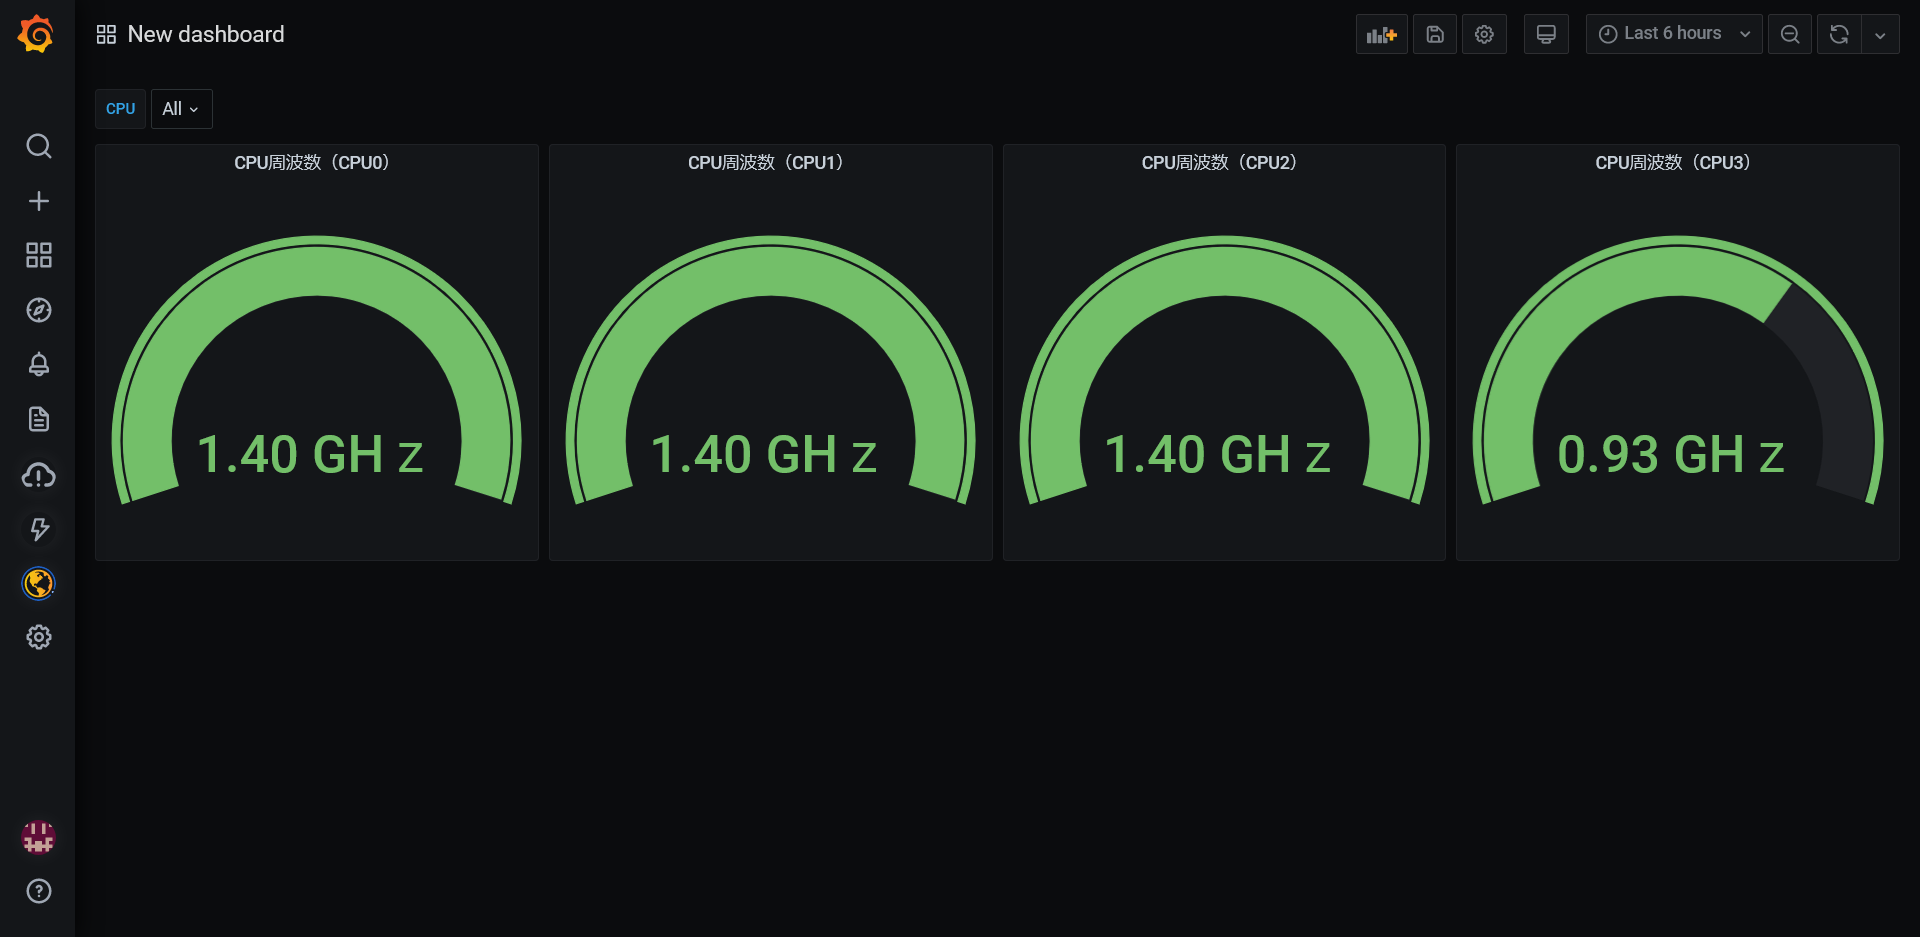
CPUコアごとの表示というのはあまり用途は無いですが、監視対象の全ホストのCPU利用率を一覧で見るなどは使いみちがあるかと思いました。