
今年の夏も暑かったですね。エアコンがないとやってられませんでした。 ふと、エアコンの電力消費が気になりましたので可視化してみました。
全体構成
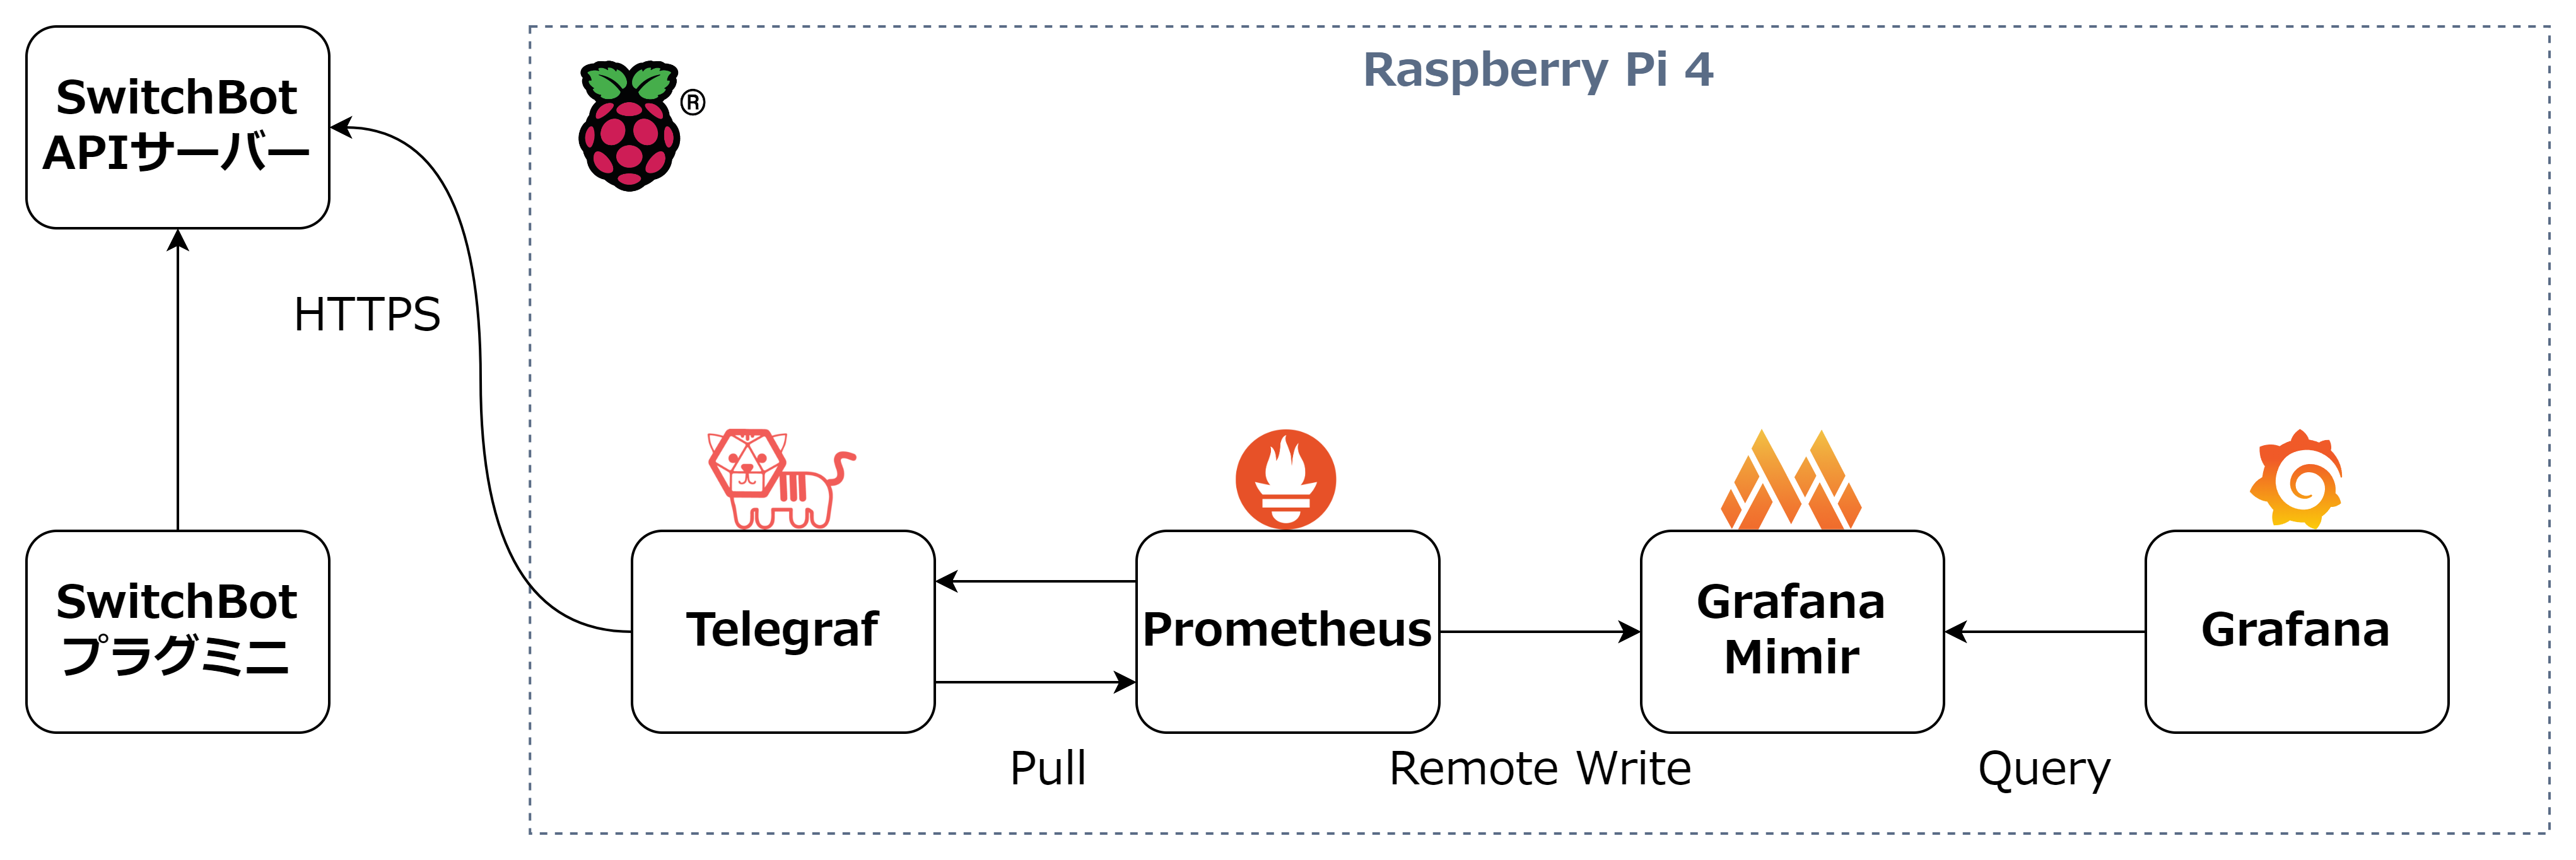
用意するもの
ハードウェア
SwitchBotプラグミニ
SwitchBotプラグミニはBluetoothとWi-Fiに対応可能なので、Wi-Fiチップのみのスマートプラグよりデバイスの追加と操作がより簡単に。Bluetoothの通信範囲内、操作スピードがより速い、Wi-Fi接続が途切れても変わらず使用できます。一度アプリに追加すれば、旅行や引越しの際に再度設定する必要がなく、コンセントに差し込んですぐ使えます。
出典:Amazonの商品説明
スマホから操作できるスマートプラグですが、消費電力を取得することも可能です。また、APIが用意されており、GitHubにAPI仕様が公開されています。(SwitchBot API) BluetoothだけでなくWi-Fiにも対応しており、SwitchBot ハブミニがなくともAPIからのアクセスが可能です。
本来のスマートプラグとしては使用せず、今回は消費電力の取得に使用します。😝
Raspberry Pi 4
Raspberry Pi(ラズベリー パイ)は、ARMプロセッサを搭載したシングルボードコンピュータ。イギリスのラズベリーパイ財団によって開発されている。日本語では略称としてラズパイとも呼ばれる。
出典:Wikipedia
IoTのDIYには欠かせないRaspberry Piです。
今回はRaspberry Pi 4を使用しました。
ソフトウェア
Telegraf
Telegraf is the open source server agent to help you collect metrics from your stacks, sensors, and systems.
出典:公式サイト
Telegrafは、スタック、センサー、システムからメトリクスを収集するための、オープンソースのサーバーエージェントです。
翻訳:DeepL
メトリクスを収集して送信するエージェントです。Input(収集側)とOutput(送信側)がプラグイン方式になっており、様々なメトリクスを収集して送信することが可能です。
Prometheus
Power your metrics and alerting with the leading open-source monitoring solution.
出典:公式サイト
メトリックスとアラートを強力にサポートするオープンソースのモニタリングソリューションです。
翻訳:DeepL
メトリクスの収集によく使われるソフトウェアです。PULL型のアーキテクチャが採用されています。FAQによるとPULL型のメリットは以下のとおりです。
- 必要に応じて、例えば開発時にラップトップで監視インスタンスを追加起動することができます。
- ターゲットがダウンしているかどうかを、より簡単かつ確実に知ることができます。
- 手動でターゲットにアクセスし、Web ブラウザでその健全性を検査できます。
PULLしたメトリクスを別のPrometheusサーバーに送信するRemote Write機能も提供されています。
Grafana Mimir
Grafana Mimir lets you scale metrics to 1 billion active series and beyond, with high availability, multi-tenancy, durable storage, and blazing fast query performance over long periods of time.
出典:公式サイト
Grafana Mimirは、高可用性、マルチテナンシー、耐久性のあるストレージ、長期間にわたる非常に高速なクエリパフォーマンスにより、メトリクスを10億アクティブシリーズやそれ以上に拡張することができます。
翻訳:DeepL
Prometheusはデフォルトでは15日間のデータを保持し、それよりも古いデータは削除されるようです。Prometheusのメトリクスデータを永続化するための仕組みがGrafana Mimirです。2022年に登場した新しいOSSです。
Grafana
Grafana allows you to query, visualize, alert on and understand your metrics no matter where they are stored. Create, explore, and share beautiful dashboards with your team and foster a data driven culture.
出典:公式サイト
Grafana を使用すると、メトリックがどこに保存されていても、クエリ、可視化、アラート、および理解を行うことができます。美しいダッシュボードを作成、探索、チームと共有し、データ駆動型の文化を育みます。
翻訳:DeepL
Prometheusなどのデータの可視化を担当するのがGrafanaです。Prometheus以外にも様々なデータソースに対応しています。
ソフトウェアはすべてOSSです。
SwitchBot APIから電力消費量を取得
SwitchBot APIで電力量を取得します。
2022/9/16にこの記事を作成していますが、作成途中にAPIのバージョン1.1がリリースされたようです! 以下の内容は旧バージョンの1.0を想定して記載しています。 すぐに使えなくなることはないと思いますが、新しいAPIに移行しましょう。
トークンの取得
まずはスマートフォンを使いSwitchBotプラグミニの初期設定を済ませます。 スマートフォンから利用できるようになったら、以下の手順でトークンを作成します。
プロフィール -> 設定 -> アプリバージョン を10回タップすることで 開発者向けオプション が表示される
開発者オプション に遷移し、トークンを取得します。
クライアントシークレットはAPI v1.0では使用しません
APIの使い方
デバイスリスト取得API
TOKEN={トークン}
curl -XGET -H "Authorization:${TOKEN}" https://api.switch-bot.com/v1.0/devices
{
  "statusCode": 100,
  "body": {
    "deviceList": [
      {
        "deviceId": "{デバイスID}",
        "deviceName": "プラグミニ(JP) 4E",
        "deviceType": "Plug Mini (JP)",
        "enableCloudService": true,
        "hubDeviceId": ""
      }
    ],
    "infraredRemoteList": []
  },
  "message": "success"
}
デバイスステータス取得API
電力量はデバイスステータスを取得することで取得できます
TOKEN={トークン}
DEVICEID={デバイスID}

curl -XGET -H "Authorization:${TOKEN}" https://api.switch-bot.com/v1.0/devices/${DEVICEID}/status
{
  "statusCode": 100,
  "body": {
    "deviceId": "{デバイスID}",
    "deviceType": "Plug Mini (JP)",
    "hubDeviceId": "",
    "power": "on",
    "voltage": 99.6,
    "weight": 0.4,
    "electricityOfDay": 759,
    "electricCurrent": 0.12
  },
  "message": "success"
}
各項目の意味は以下の通り
| キー | 説明 |
|---|---|
| power | ON/OFF 状態 |
| voltage | デバイスの現在の電圧(単位:V) |
| weight | その日の機器の消費電力(単位:W/min) |
| electricityOfDay | その日のデバイスの使用時間(単位:min) |
| electricCurrent | 現時点でのデバイスの電流(単位:A) |
とても簡単に消費電力情報が取得できました。
その日のデバイスの使用時間はUTC AM00:00でリセットされるようです。(日本時間でAM9:00にリセット)
Telegraf
Telegrafでは、SwitchBot APIから定期的に値を取得し、Prometheusの形式で出力します。
使用するプラグイン
| 種別 | Plugin名 | 内容 |
|---|---|---|
| Input | HTTP | 1つまたは複数の HTTP(または HTTPS)エンドポイントからメトリックスを収集します。エンドポイントは、サポートされている入力データ形式の 1 つでフォーマットされたメトリッ クを持っている必要があります。各データ形式は、入力設定に追加できる独自の設定オプションのセットを持っています。 |
| Output | Prometheus Client | Prometheus Clientを起動し、Prometheusサーバからポーリングされるように/metrics(デフォルト)に全てのメトリクスを公開します。 |
設定ファイル
- HTTPプラグイン
リクエストURLやHTTPヘッダーの情報を記載します。
トークンやデバイスIDを環境変数で渡す方法がわからなかったので直接記載しています。
HTTPレスポンスがJSONのため、data_formatでjson_v2を指定し、body以下のみに絞っています。
[[inputs.http]]
  interval = "60s"

  urls = [
    "https://api.switch-bot.com/v1.0/devices/{デバイスID}/status"
  ]

  method = "GET"

  headers = {"Authorization" = "{トークン}"}

  data_format = "json_v2"
      [[inputs.http.json_v2]]
          [[inputs.http.json_v2.object]]
              path = "body"
- Prometheus Clientプラグイン
Outputプラグインは使用するポートの指定のみです。
[[outputs.prometheus_client]]
  listen = ":9273"
- telegraf.conf
設定ファイル全体はこのようになります。
[global_tags]

[agent]
  interval = "60s"
  round_interval = true
  metric_batch_size = 1000
  metric_buffer_limit = 10000
  collection_jitter = "0s"
  flush_interval = "10s"
  flush_jitter = "0s"
  precision = "0s"
  hostname = ""
  omit_hostname = false

[[outputs.prometheus_client]]
  listen = ":9273"

[[inputs.http]]
  interval = "60s"

  urls = [
    "https://api.switch-bot.com/v1.0/devices/{デバイスID}/status"
  ]

  method = "GET"

  headers = {"Authorization" = "{トークン}"}

  data_format = "json_v2"
      [[inputs.http.json_v2]]
          [[inputs.http.json_v2.object]]
              path = "body"
起動
Docker Composeで起動します。
- docker-compose.yaml
version: '3'

services:
  telegraf:
    image: telegraf
    ports:
      - "9273:9273"
    volumes:
      - ./telegraf.conf:/etc/telegraf/telegraf.conf:ro
起動します。
docker compose up -d
http://[IPアドレス]:9273/metricsにアクセスすると、SwitchBot APIから取得した値がPrometheusのMetrics形式で出力されます。
## HELP http_electricCurrent Telegraf collected metric
## TYPE http_electricCurrent untyped
http_electricCurrent{deviceId="{デバイスID}",deviceType="Plug Mini (JP)",host="{ホスト名}",hubDeviceId="{デバイスID}",power="on",url="https://api.switch-bot.com/v1.0/devices/{デバイスID}/status"} 0
## HELP http_electricityOfDay Telegraf collected metric
## TYPE http_electricityOfDay untyped
http_electricityOfDay{deviceId="{デバイスID}",deviceType="Plug Mini (JP)",host="{ホスト名}",hubDeviceId="{デバイスID}",power="on",url="https://api.switch-bot.com/v1.0/devices/{デバイスID}/status"} 783
## HELP http_voltage Telegraf collected metric
## TYPE http_voltage untyped
http_voltage{deviceId="{デバイスID}",deviceType="Plug Mini (JP)",host="{ホスト名}",hubDeviceId="{デバイスID}",power="on",url="https://api.switch-bot.com/v1.0/devices/{デバイスID}/status"} 99.6
## HELP http_weight Telegraf collected metric
## TYPE http_weight untyped
http_weight{deviceId="{デバイスID}",deviceType="Plug Mini (JP)",host="{ホスト名}",hubDeviceId="{デバイスID}",power="on",url="https://api.switch-bot.com/v1.0/devices/{デバイスID}/status"} 0
http_electricCurrent、http_electricityOfDay、http_voltage、http_weightとしてメトリクスが公開されていることがわかります。
Grafana Mimir
Prometheusの前にGrafana Mimirを設定します。
設定ファイル
あまり理解してないですが、Get started with Grafana Mimirを参考に設定ファイルを用意します。
/tmpだと再起動時に消えてしまうので、/dataを使用しています。
- mimir.yaml
## Do not use this configuration in production.
## It is for demonstration purposes only.
multitenancy_enabled: false

blocks_storage:
  backend: filesystem
  bucket_store:
    sync_dir: /data/mimir/tsdb-sync
  filesystem:
    dir: /data/mimir/data/tsdb
  tsdb:
    dir: /data/mimir/tsdb

compactor:
  data_dir: /data/mimir/compactor
  sharding_ring:
    kvstore:
      store: memberlist

distributor:
  ring:
    instance_addr: 127.0.0.1
    kvstore:
      store: memberlist

ingester:
  ring:
    instance_addr: 127.0.0.1
    kvstore:
      store: memberlist
    replication_factor: 1

ruler_storage:
  backend: filesystem
  filesystem:
    dir: /data/mimir/rules

server:
  http_listen_port: 9009
  log_level: error

store_gateway:
  sharding_ring:
    replication_factor: 1
起動
docker-compose.yamlを修正します。
- docker-compose.yaml
version: '3'

services:
  mimir:
    image: grafana/mimir:latest
    ports:
      - "9009:9009"
    volumes:
      - ./mimir.yaml:/etc/mimir/demo.yaml
      - mimir-data:/data
    command: ["--config.file=/etc/mimir/demo.yaml"]

  telegraf:
    image: telegraf
    ports:
      - "9273:9273"
    volumes:
      - ./telegraf.conf:/etc/telegraf/telegraf.conf:ro

volumes:
  mimir-data:
起動します。
docker compose down && docker compose up -d
http://[IPアドレス]:9009/にアクセスし、Admin画面が表示されることを確認します。
Prometheus
Telegrafで公開しているメトリクスをPrometheusで収集し、MimirにRemote Writeします。
設定ファイル
変更点
scrape_intervalとevaluation_intervalを60sに変更scrape_configsにTelegrafを追加- Mimirへの
remote_write設定の追加
- prometheus.yml
## my global config
global:
  scrape_interval: 60s # Set the scrape interval to every 15 seconds. Default is every 1 minute.
  evaluation_interval: 60s # Evaluate rules every 15 seconds. The default is every 1 minute.
  # scrape_timeout is set to the global default (10s).

## Alertmanager configuration
alerting:
  alertmanagers:
    - static_configs:
        - targets:
          # - alertmanager:9093

## Load rules once and periodically evaluate them according to the global 'evaluation_interval'.
rule_files:
  # - "first_rules.yml"
  # - "second_rules.yml"

## A scrape configuration containing exactly one endpoint to scrape:
## Here it's Prometheus itself.
scrape_configs:
  # The job name is added as a label `job=<job_name>` to any timeseries scraped from this config.
  - job_name: "prometheus"

    # metrics_path defaults to '/metrics'
    # scheme defaults to 'http'.

    static_configs:
      - targets: ["localhost:9090"]

  # The job name is added as a label `job=<job_name>` to any timeseries scraped from this config.
  - job_name: "telegraf"

    # metrics_path defaults to '/metrics'
    # scheme defaults to 'http'.

    static_configs:
      - targets: ["telegraf:9273"]

remote_write:
  - url: http://mimir:9009/api/v1/push
起動
- docker-compose.yaml
version: '3'

services:
  mimir:
    image: grafana/mimir:latest
    ports:
      - "9009:9009"
    volumes:
      - ./mimir.yaml:/etc/mimir/demo.yaml
      - mimir-data:/data
    command: ["--config.file=/etc/mimir/demo.yaml"]

  prometheus:
    image: prom/prometheus
    ports:
      - "9090:9090"
    volumes:
      - ./prometheus.yml:/etc/prometheus/prometheus.yml

  telegraf:
    image: telegraf
    ports:
      - "9273:9273"
    volumes:
      - ./telegraf.conf:/etc/telegraf/telegraf.conf:ro

volumes:
  mimir-data:
起動します。
docker compose down && docker compose up -d
http://[IPアドレス]:9090/metricsでPrometheus自体のメトリクスが表示されれば成功です。
また、http://[IPアドレス]:9090/targetsにtelegraf( http://telegraf:9273/metrics )が表示されていて、StatusがUPであれば正しくTeregrafからの収集ができていることがわかります。
Grafana
最後にGrafanaを起動します。
起動
- docker-compose.yaml
version: '3'

services:
  mimir:
    image: grafana/mimir:latest
    ports:
      - "9009:9009"
    volumes:
      - ./mimir.yaml:/etc/mimir/demo.yaml
      - mimir-data:/data
    command: ["--config.file=/etc/mimir/demo.yaml"]

  grafana:
    image: grafana/grafana-oss
    ports:
      - "3000:3000"
    volumes:
      - grafana-storage:/var/lib/grafana

  prometheus:
    image: prom/prometheus
    ports:
      - "9090:9090"
    volumes:
      - ./prometheus.yml:/etc/prometheus/prometheus.yml

  telegraf:
    image: telegraf
    ports:
      - "9273:9273"
    volumes:
      - ./telegraf.conf:/etc/telegraf/telegraf.conf:ro

volumes:
  mimir-data:
  grafana-storage:
起動します。
docker compose down && docker compose up -d
http://[IPアドレス]:3000にアクセスすることでGrafanaの画面が表示されれば成功です。
Grafanaダッシュボードの作成
いよいよ準備が整いました。電力消費量を可視化してみましょう。
Grafanaにログイン
初期アカウントはusername admin、Password admin です。
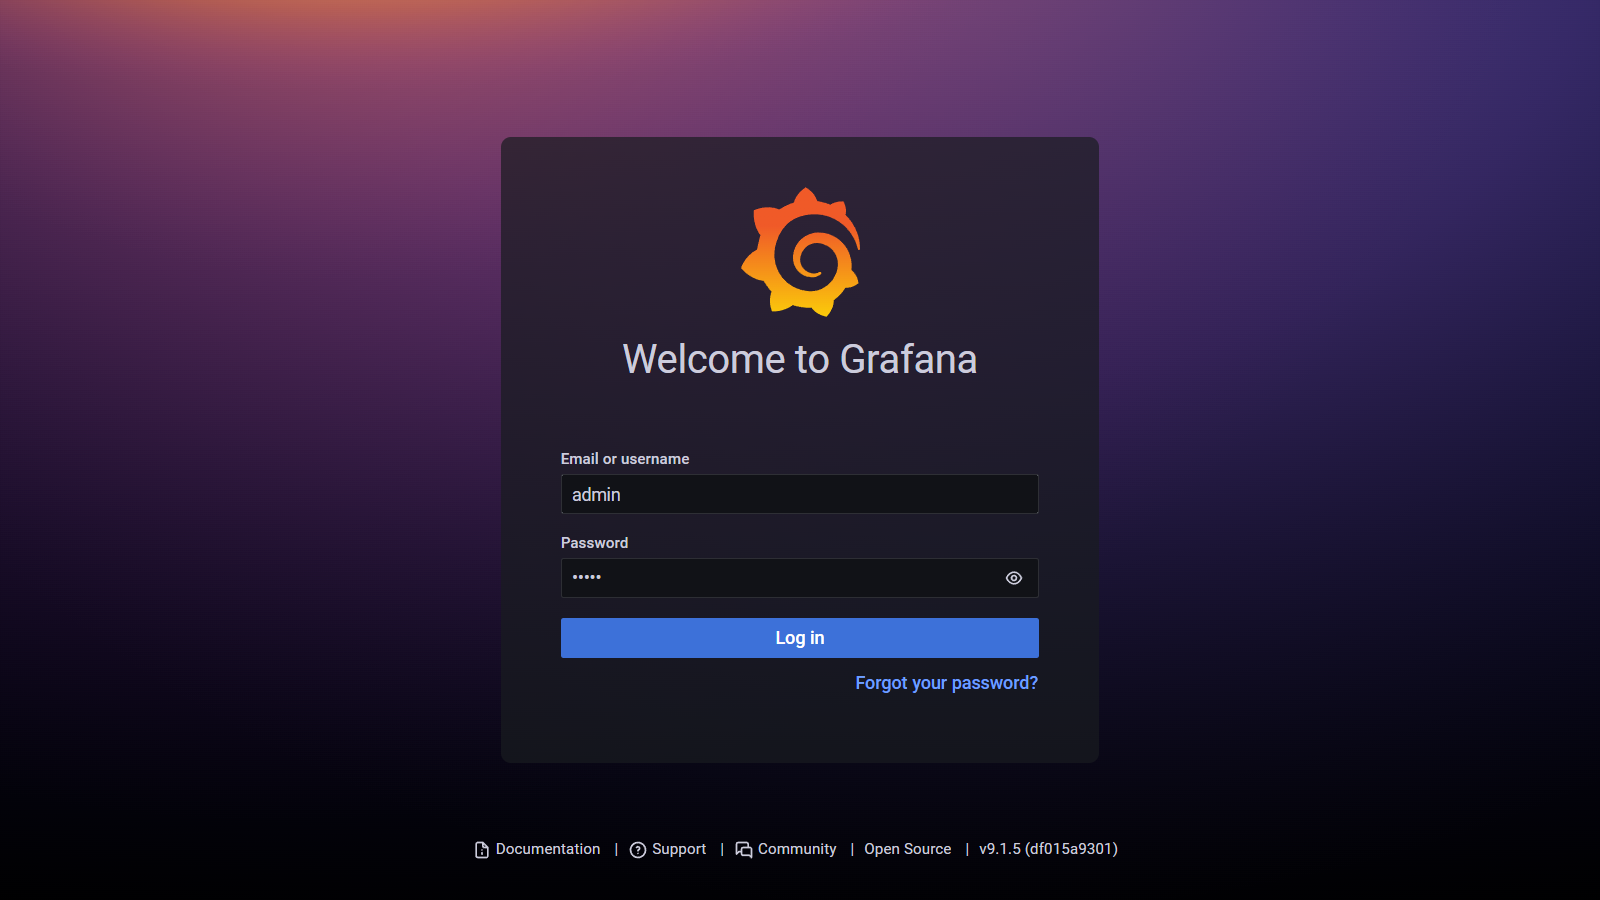
パスワード変更を促されますので、変更しましょう。
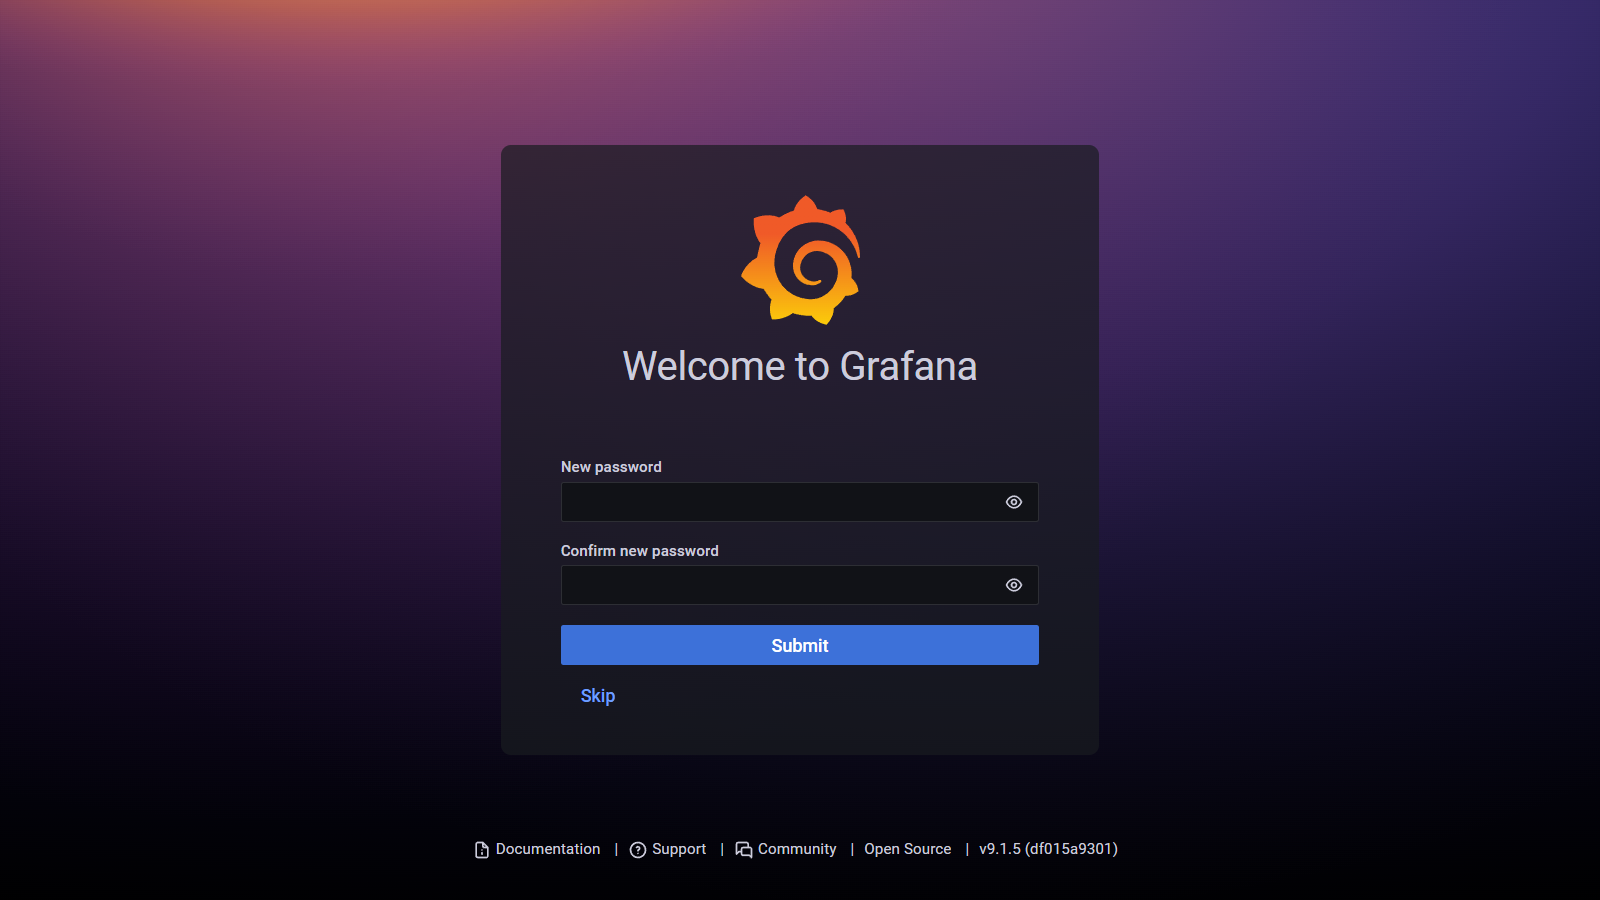
Skipすることもできます
Data Sourceの追加
左メニューの下から4つ目にあるConfigurationからData sourcesを選択します。
Add data sourceボタンをクリックします。
表示されるデータソースの中の、Prometheusを選択します。
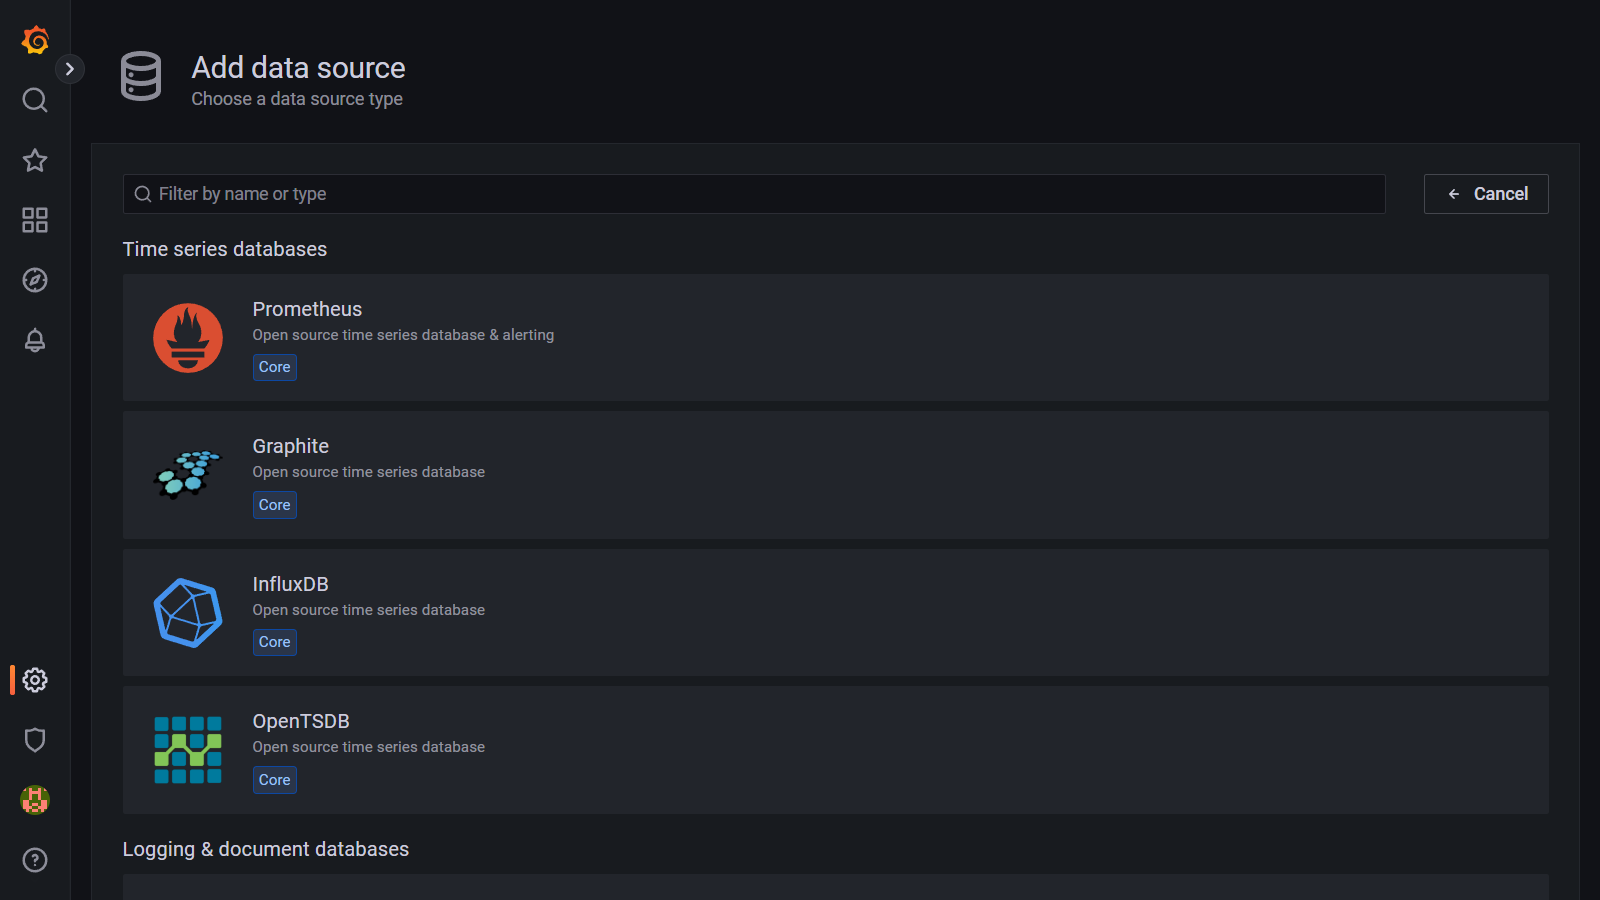
Nameに名前をつけ、URLにhttp://mimir:9009/prometheusと入力します。
その他の項目はデフォルトのままで、Save & testボタンをクリックします。
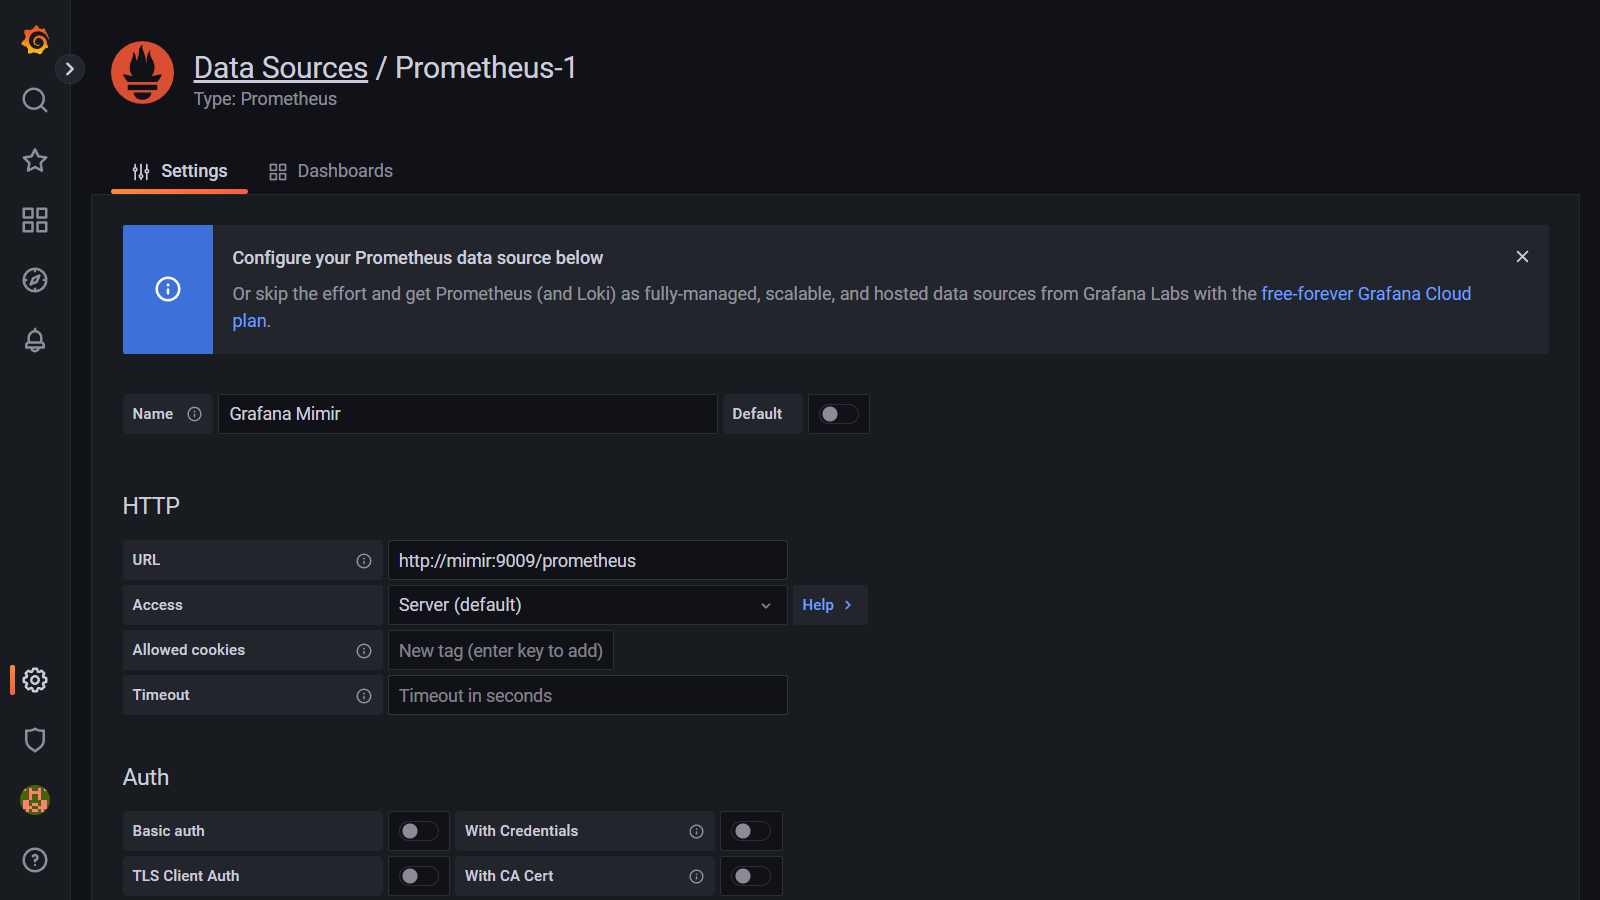
http://prometheus:9090を指定することでPrometheusサーバーを指定することもできます。
ダッシュボードの作成
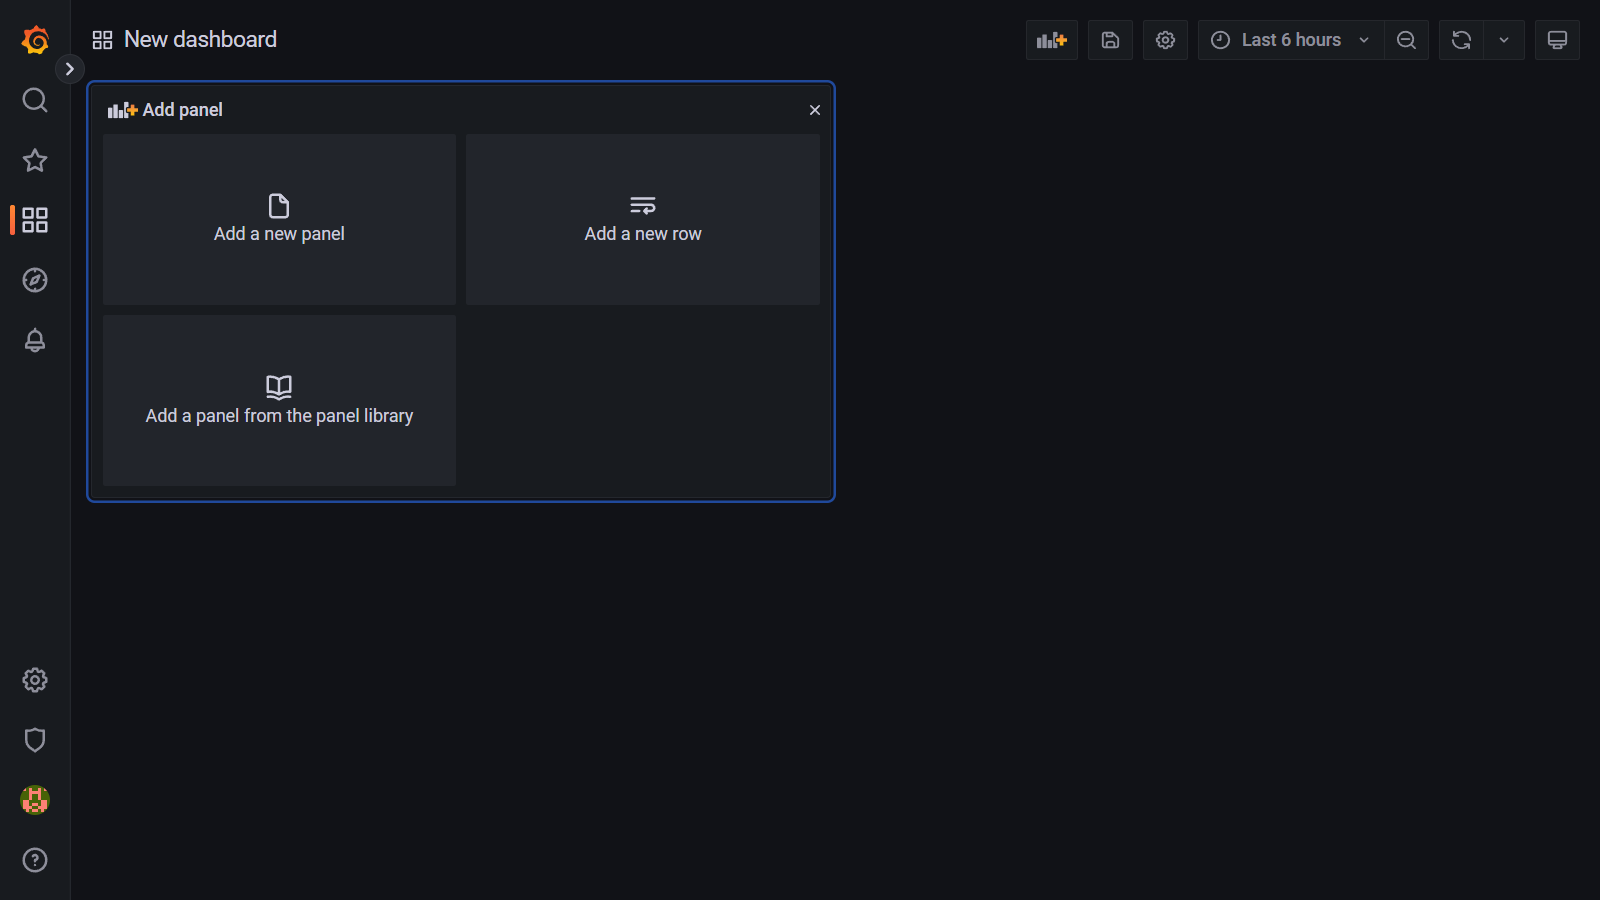
左メニューのDashboardsからNew dashboardを選択します。
Add a new panelを選択します。
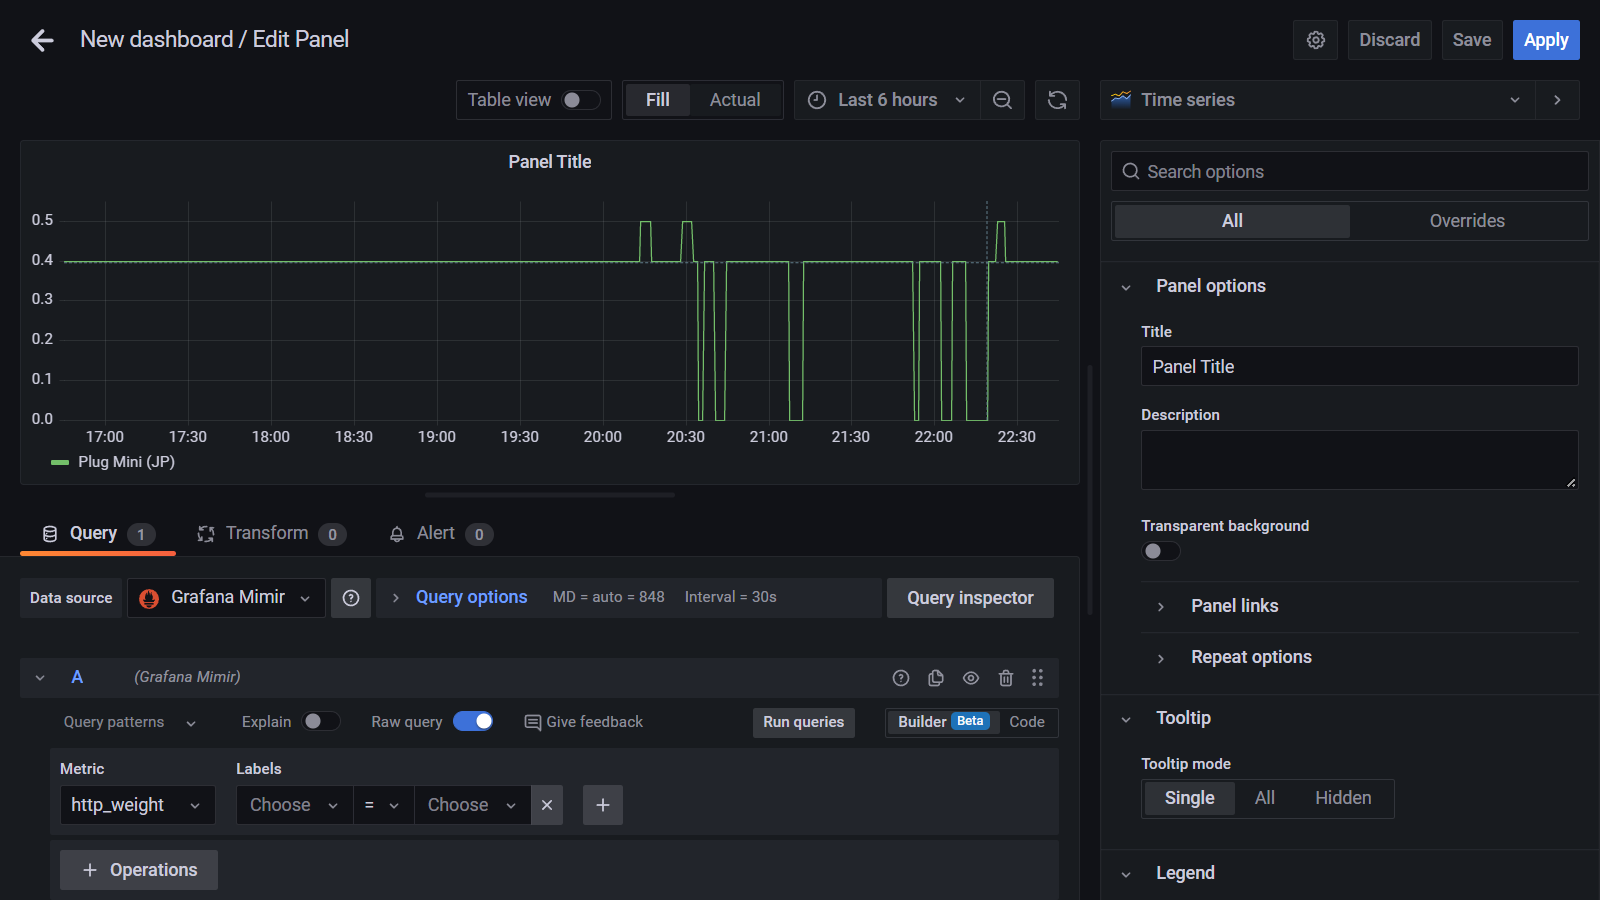
Metric欄にhttp_weightを入力し、Run queriesボタンをクリックします。
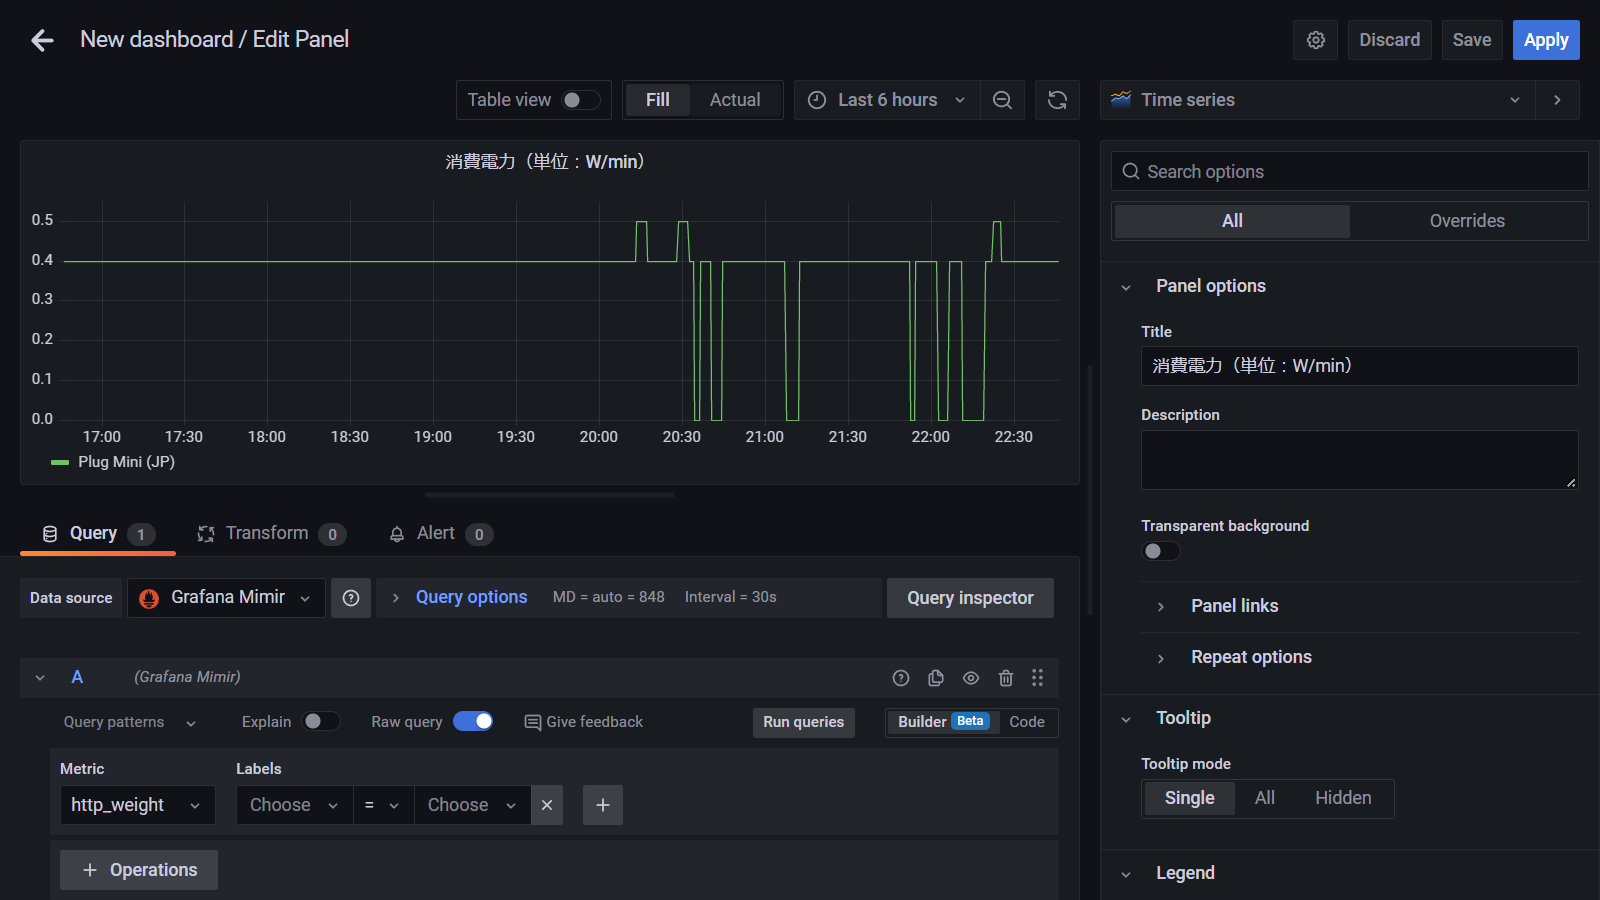
右側のTitleに消費電力(単位:W/min)と入力しApplyボタンをクリックします。
画面上部の保存(フロッピーアイコン)から保存しましょう。
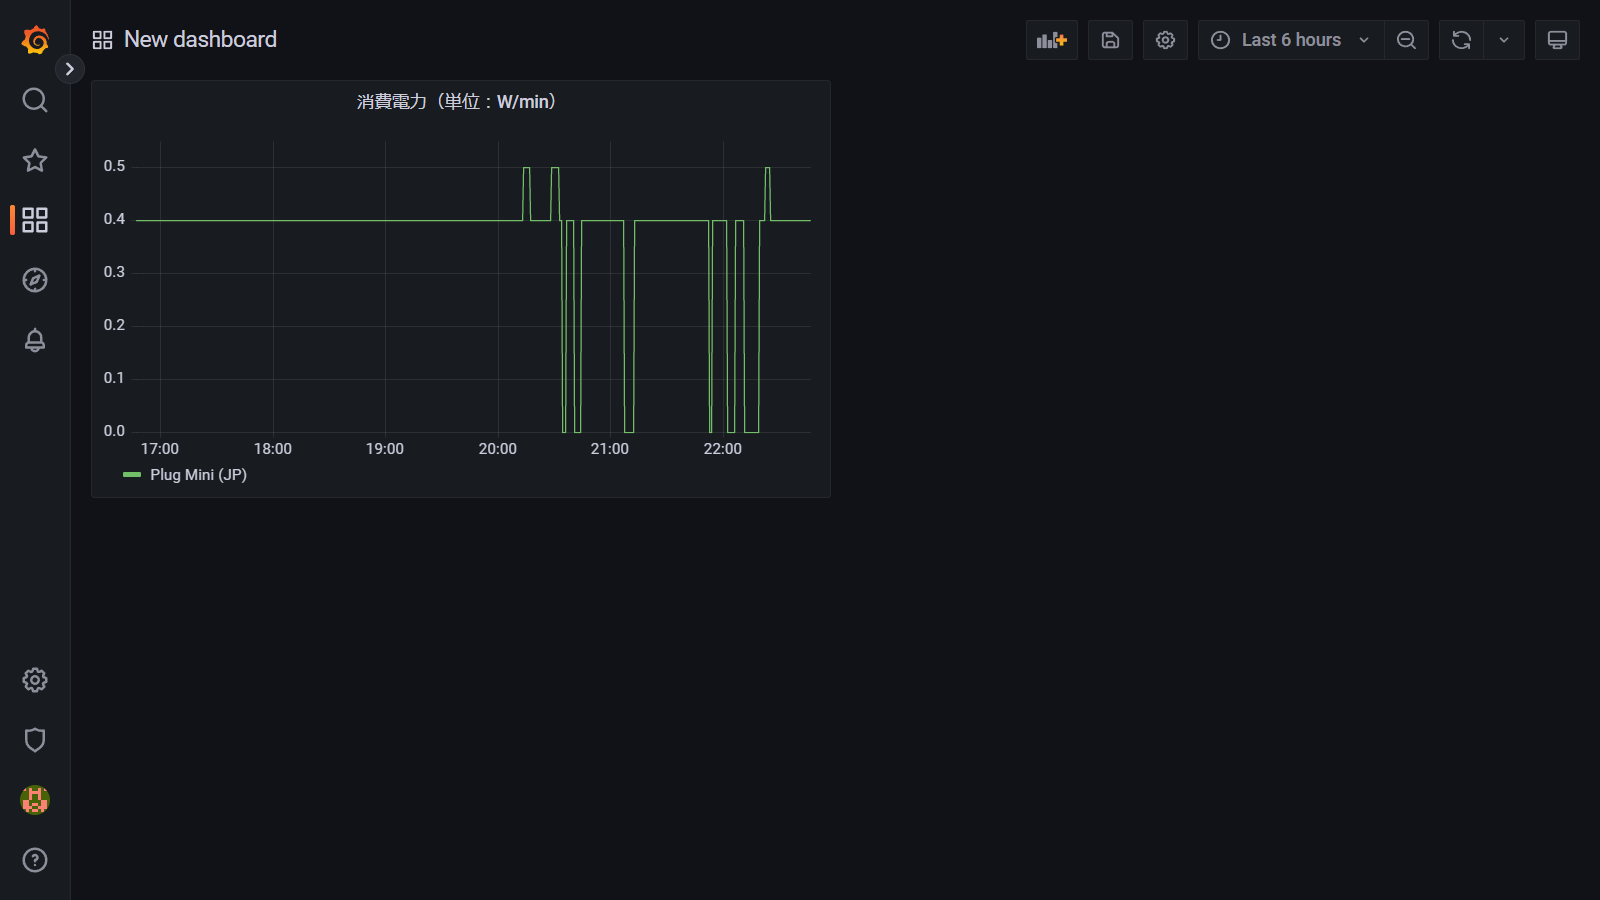
消費電力のグラフが追加されました。
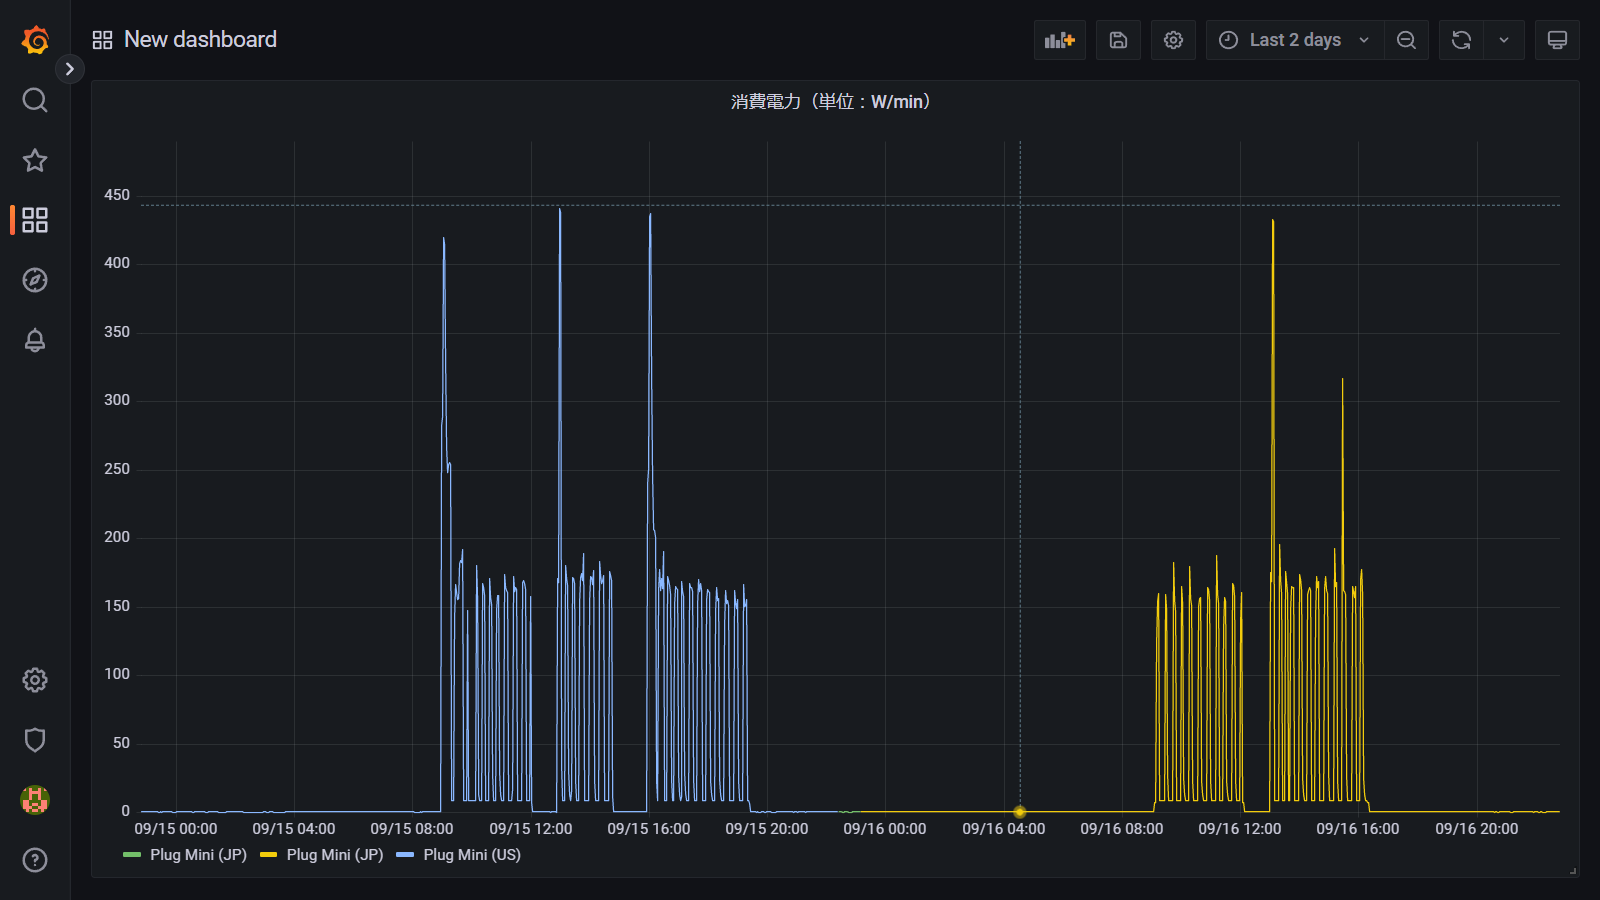
2日間測定した結果、エアコンを付けた直後に400W/min以上の消費がありますがすぐに下り、160W/min前後と10W/min前後を行ったり来たりしていることがわかりました。
完成
他に気温や湿度の情報も表示し、電気代も計算してみました。 在宅勤務でしたのでAM9:00前にエアコンを入れ、夕方辺りまでエアコンを使っていたことがまるわかりですね。
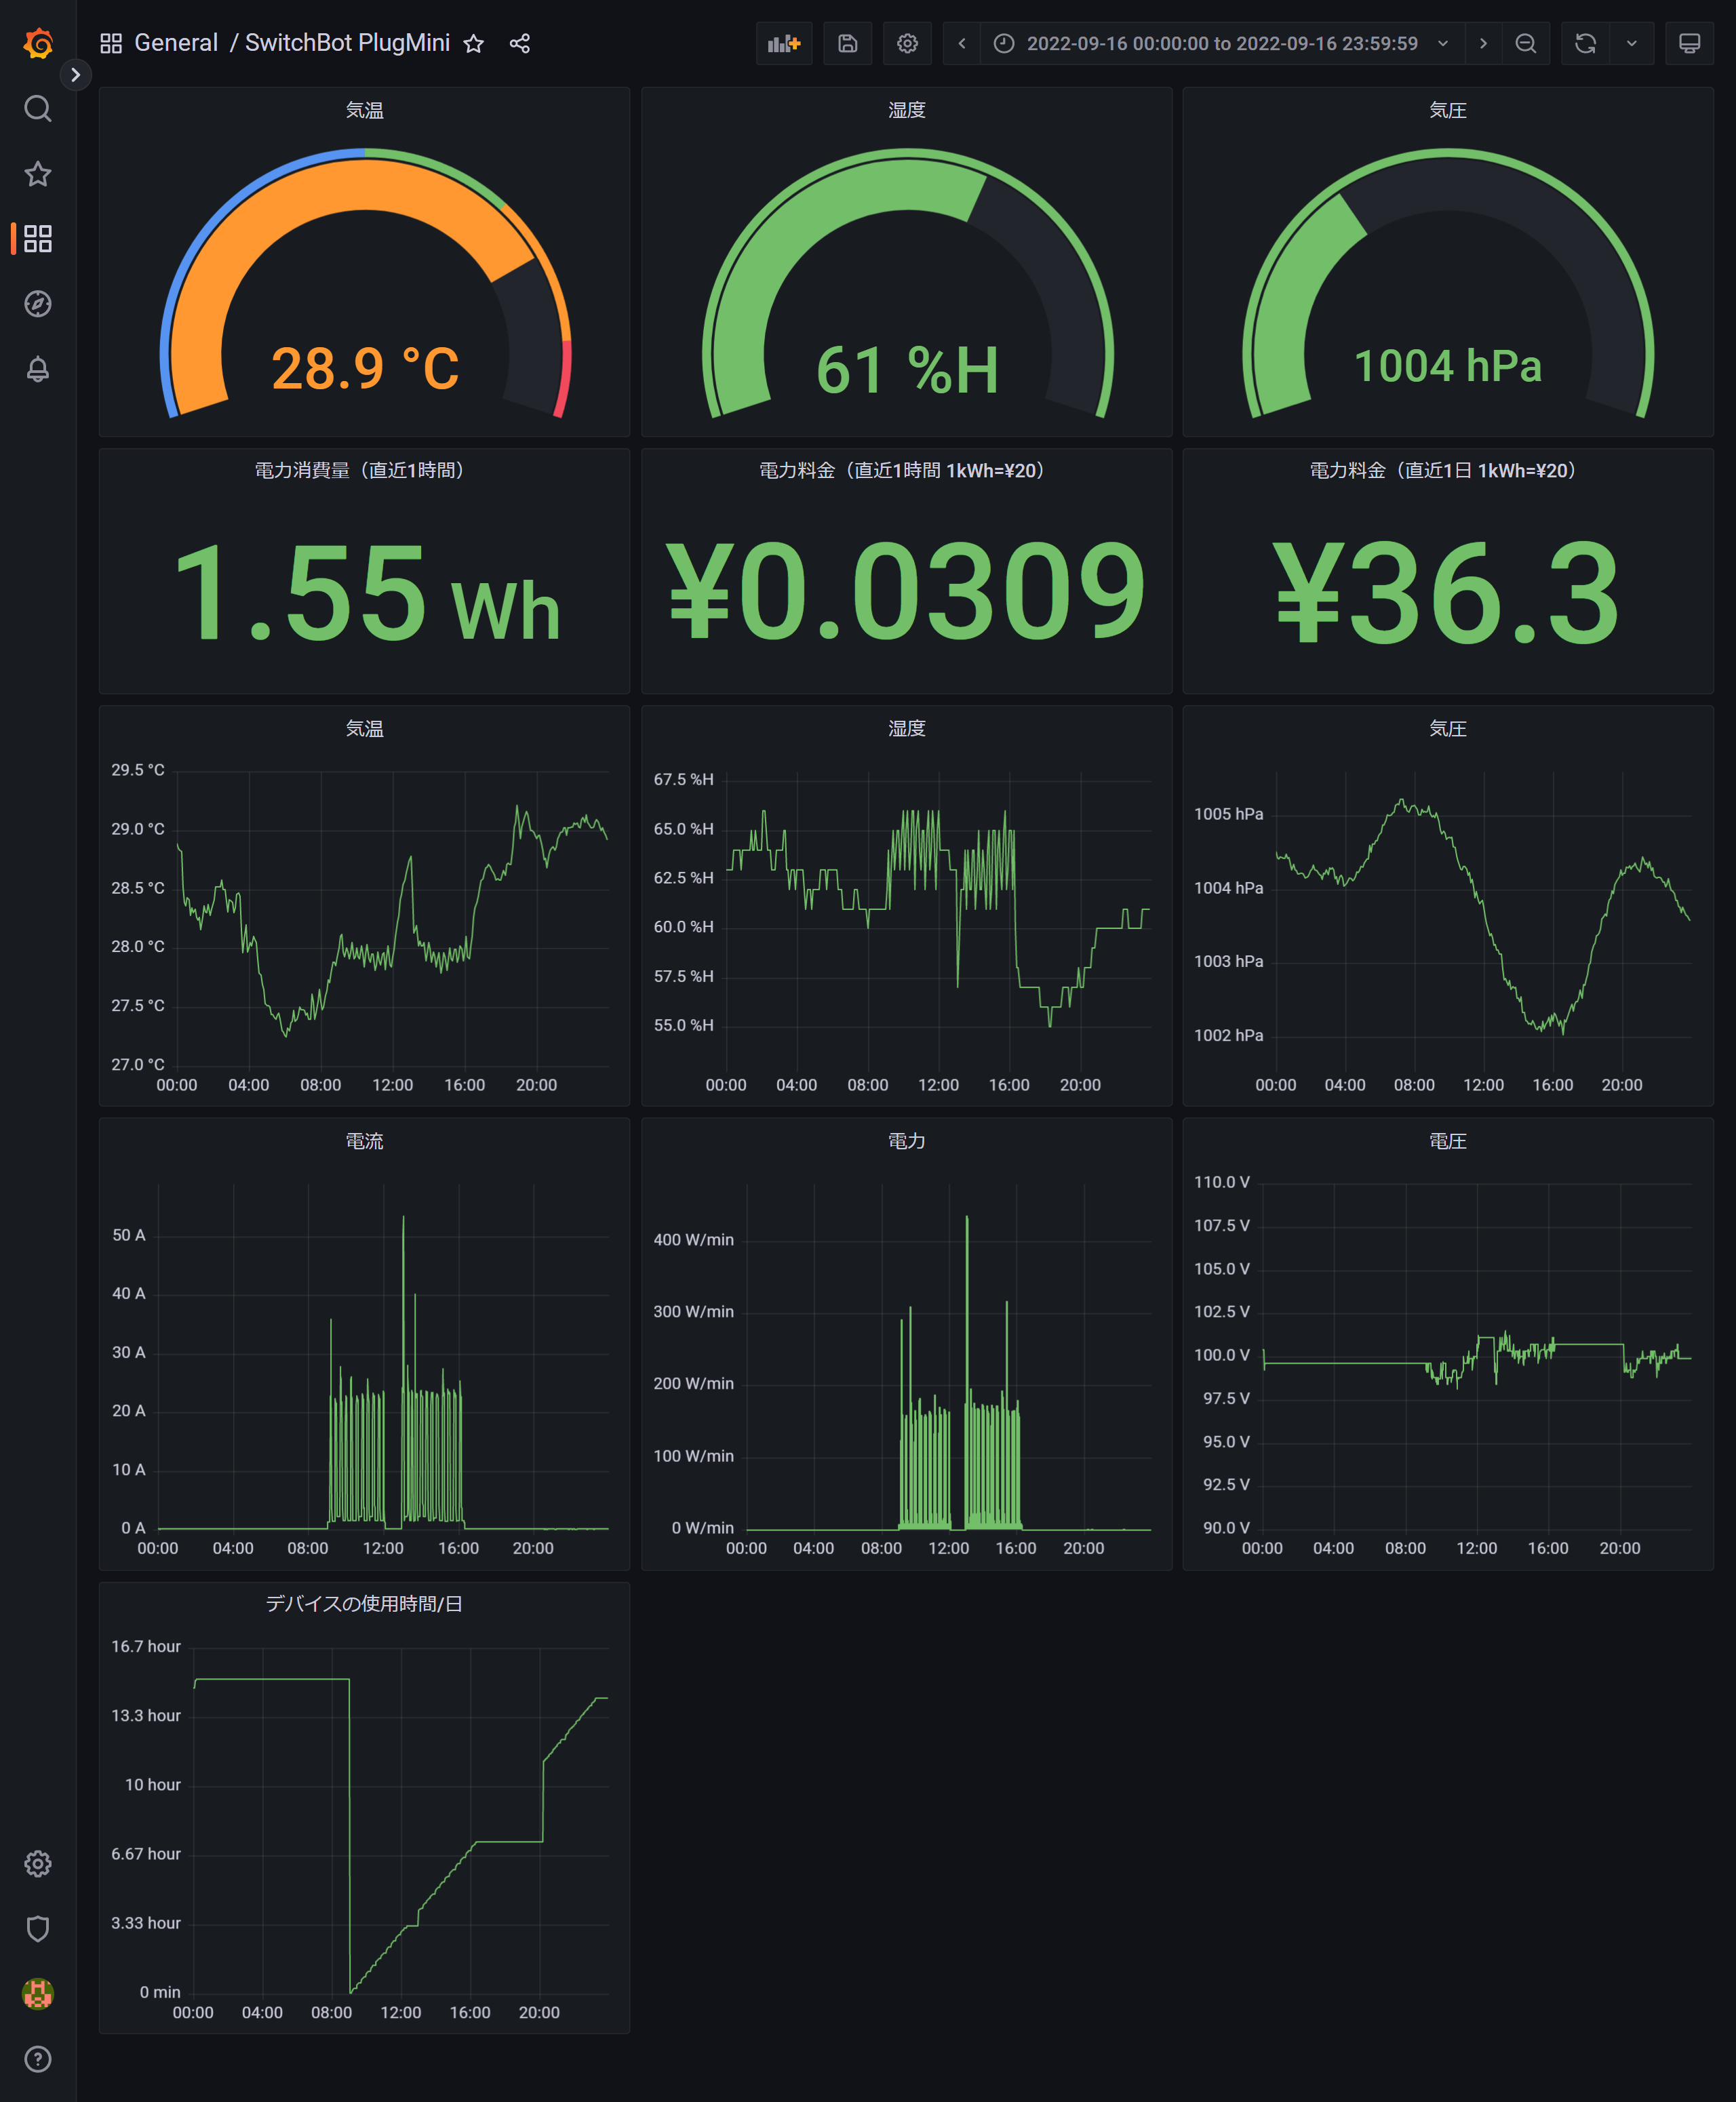
💡夏場はエアコンつけっぱなしが節電効果があると聞いたことがありますが、このグラフの様子だと、マメに消したほうが良いように見えますね。
